It’s the harsh reality of any business that perfection is unattainable.
However!
One should always strive towards it. That’s why we’re currently hard at work on a new Driver Behaviour solution for our Mapon system users.
With it, you’ll know EXACTLY who’s the most economical, the most ecological and the most efficient of your drivers. And, more importantly, you will know the ones who need to improve: their performance growth will inevitably lead to your business growing as well!
So, how will it work?
Let’s take you through it.
From Cruise Control to Idle Time: You’ll See it All
Mapon likes to do things simply and efficiently: Driver Behaviour is no different.
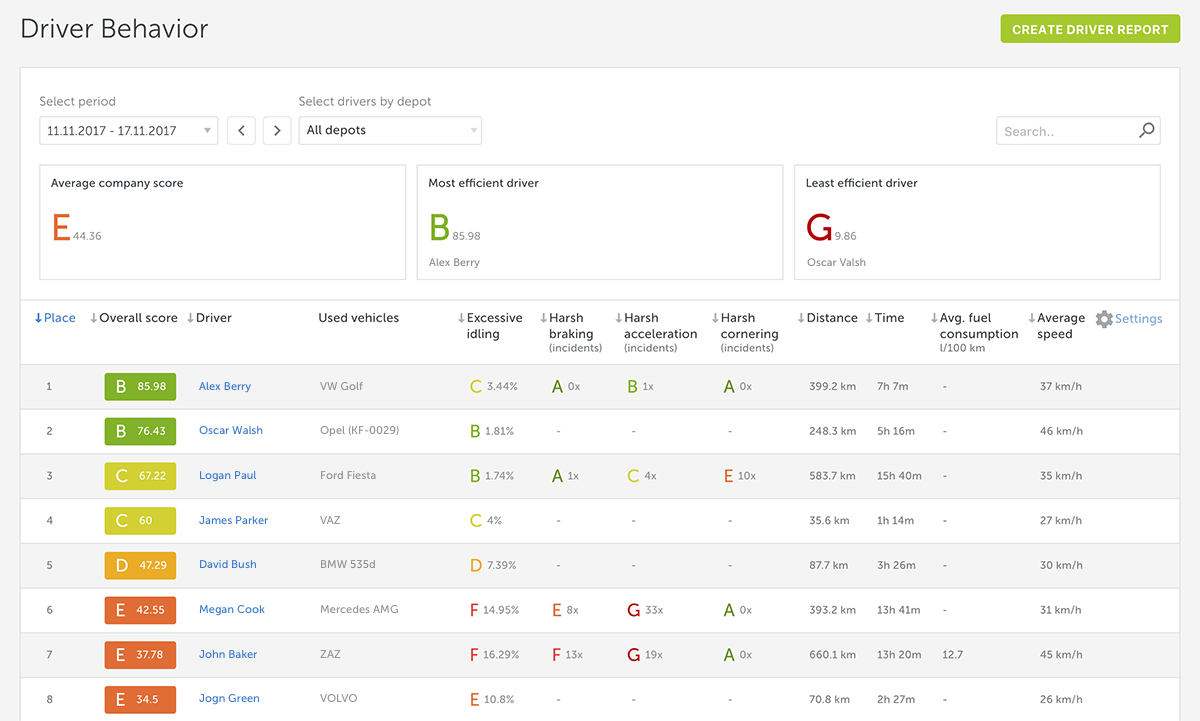
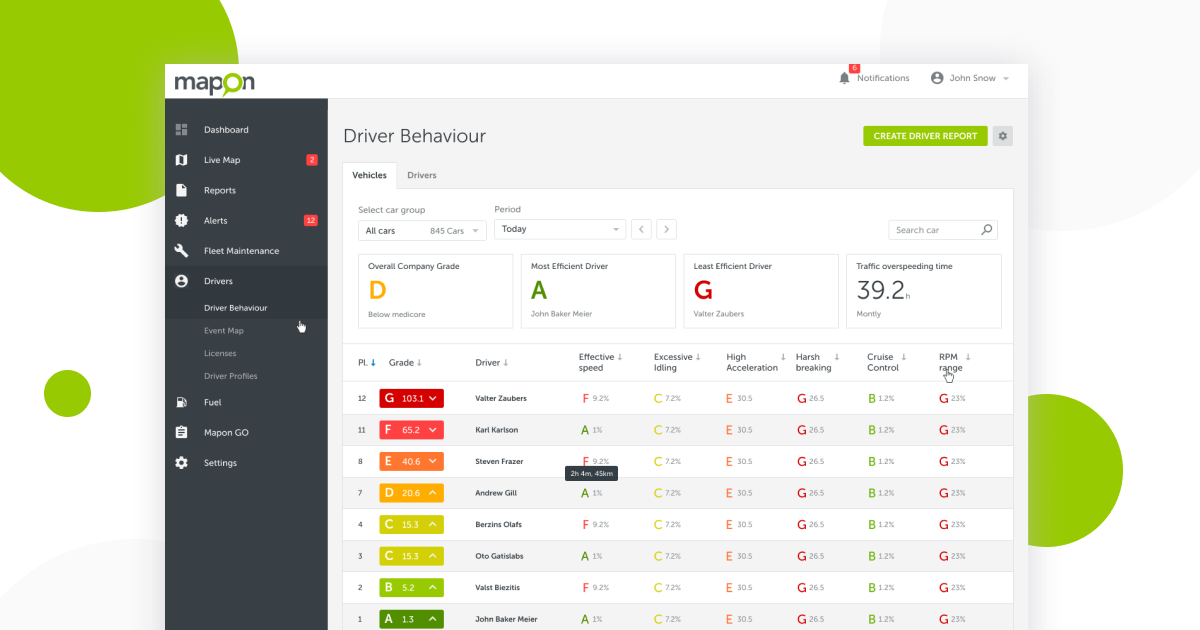
The overall look comes in the form of a list that will showcase all your drivers ranked according to their overall performance from A being the highest to G the lowest mark.
You can set the list so it is in an ascending or descending order, according to the overall rank or other options. More on that latter!
Seeing the overall rank will allow you to see which drivers have and haven’t brought their A game (get it?) within the set time period – which can be as little as a day and more than a month.
You don’t want your drivers to skirt the law when they’re doing their job, burn more fuel than is necessary or, perhaps, damage their vehicle through careless driving. Knowing who’s underperforming will let you nub the issue as quickly as possible.
As mentioned, you can also focus on specific attributes of their driving:

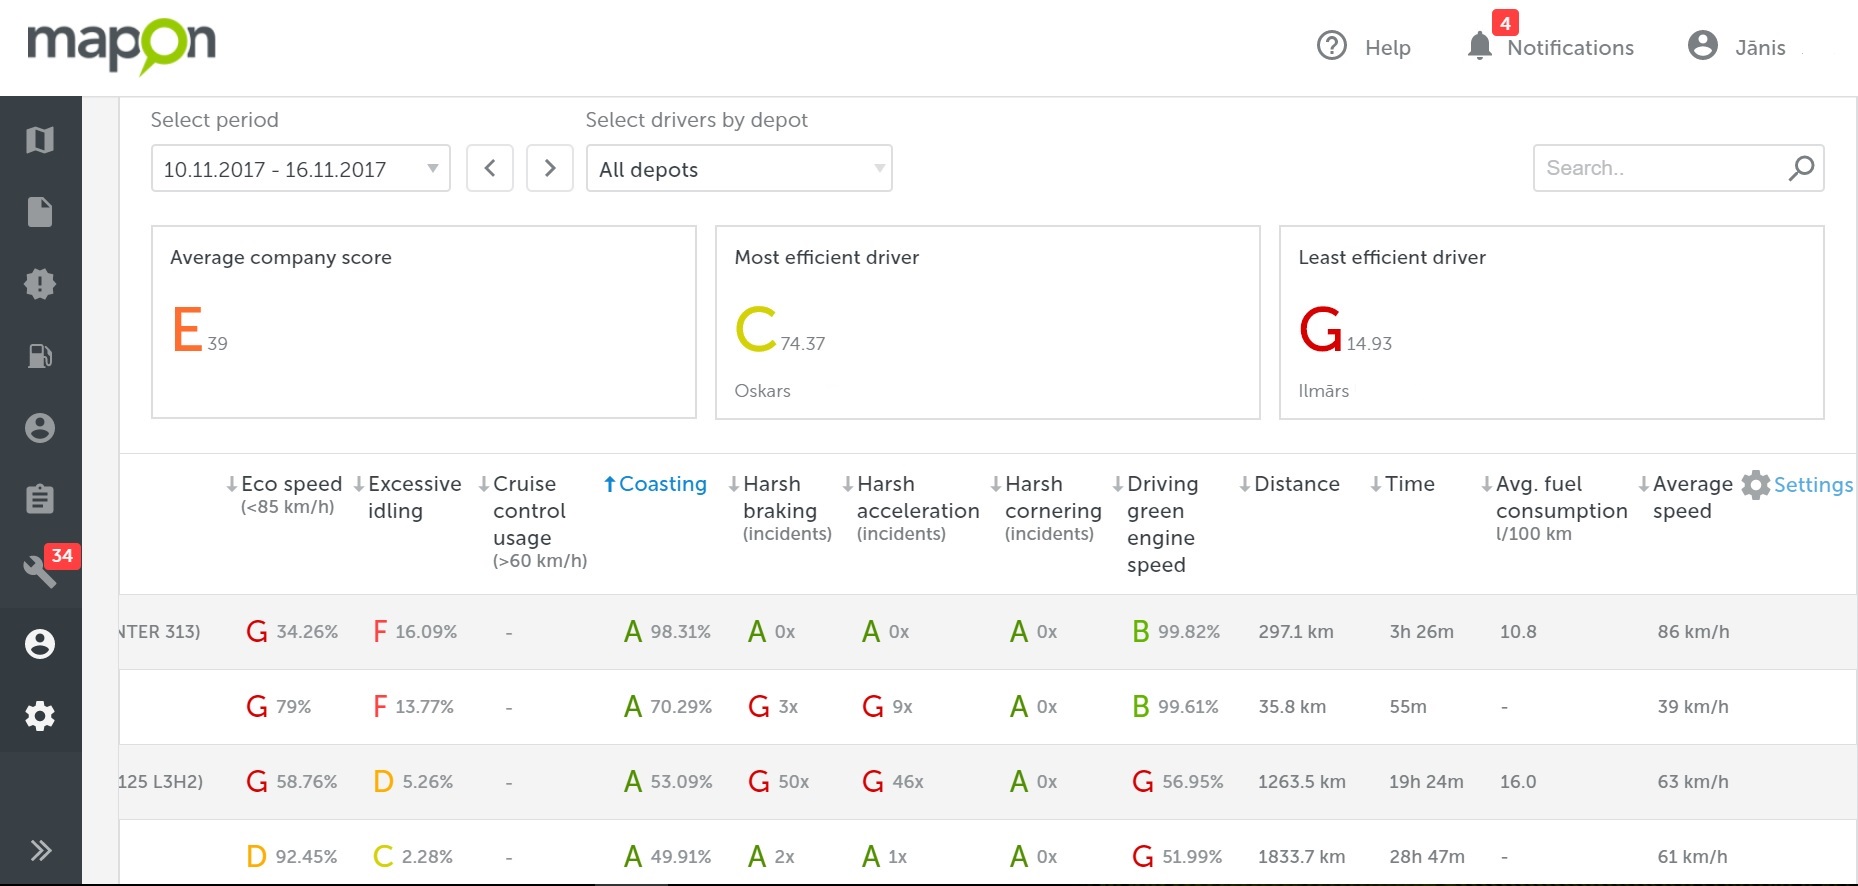
As in the illustration above, there are the following categories (vehicle numbers and surnames have been deleted for safety and legal reasons):
Eco speed
It denotes if the driver has been within the limits and not above the speed limit of 85 km/h. Displayed as a percentage of the total driving time. While a truck driving at 90 km/h or more might arrive maybe 10 or 15 minutes earlier at best, it will consume much more fuel as well. According to BTAC/IRTE (British Transport Advisory Committee/Institute of Road Transport Engineers) technical trials of June 2000, when the same distance was driven was compared at 80 km/h or 90 km/h, the latter led to an increase of fuel usage of about 8 litres (i.e. from 29.7l to 37.8l for 100 km).
Excessive idling
It denotes the time the truck spends not moving with the engine still on. Displayed as a percentage of the total driving time. Idling is seen as excessive if it’s around 2 minutes or longer. Granted, idling can sometimes happen when a truck is stuck in a traffic jam or at a red light. In these excusable occurrences, you can contact your driver through the system or through the Mapon Driver app, if you have the latter.
However, pointless idling should be controlled and curbed because it still burns fuel and creates needless emissions: for example, an hour of idle time will consume around 2-3 liters of fuel, plus create 4,6 kg of CO2 emissions.
On many occasions, idle time is created when a driver waits for the engine to “warm up”, albeit this is completely unnecessary – smooth and gentle driving will warm it up sufficiently, plus too much idling can actually damage the engine.
Furthermore, a lot of idle time is accumulated through the drivers keeping the engine running during rest periods – everybody wants to sleep in warmth and comfort. There are multiple ways to cut down on needless fuel consumption without limiting the conditions for the driver: from Auxiliary Power Units to Cab Heaters – all are worth looking into.
Cruise control usage
Speed over 60 km/h with cruise control ON will be detected as cruise control usage. Displayed as % of the total driving time over 60 km/h. Cruise control makes driving much smoother which lessens fuel consumption and reduces maintenance costs which can be the direct result of jittery and inconsistent driving.
Additionally, most modern trucks use adaptive cruise control which reacts to the terrain according to relief maps within the cruise control’s system. It will increase speed, for example, just before the road goes upwards, then let inertia do the rest to the very top. Afterwards, cruise control will control the inertia driven descent.
This is just one amongst many examples of how this system will result in the journey being considerably less stressful and more enjoyable for the drivers as well.
Coasting
Defined when the vehicle is moving with cruise control OFF, accelerator pedal not pressed, brake pedal not pressed and vehicle speed being above 10 km/h. Displayed as % of the total driving time. By using the inertia of the vehicle, fuel, brakes and tires are saved. And so is money.
Harsh braking
A sharp decrease in speed will be detected as harsh braking. Displayed as a number of times in the selected period. Harsh braking is bad for numerous reasons: it can indicate aggressive or unsafe driving which can lead to accidents or wear down the brakes. Furthermore, accelerating after harsh braking will burn down an excessive amount of fuel. It can also be seen as a sign of bad route observation or the driver losing attention due to tiredness.
Harsh Acceleration
A sudden increase in speed will be detected as harsh acceleration. Displayed as a number of times in the selected period. Harsh acceleration can also indicate aggressive or unsafe driving which can lead to an accident or wasteful and uneconomic driving. It is excessive and leads to increase in fuel consumption and maintenance costs.
Harsh cornering
High lateral acceleration will be detected as harsh cornering. Displayed as the number of times in the selected period. Harsh cornering can indicate aggressive or unsafe driving which can lead to accidents or wasteful and uneconomic driving. It can also lead to tragic results: the heavy truck, especially if it is carrying a weighty load, can tip over from too harsh cornering.
It is also excessive and also leads to increase in fuel consumption and maintenance costs, just like harsh acceleration and braking does. If a driver displays bad scores in all three of the aforementioned categories, it might be seen as a result of lack of rest, bad driving habits or bad choice of roads. In either case, it should be looked into.
Driving green engine speed
Calculates total time when truck’s RPM (revolutions per minute) don’t exceed 1750 RPM’s. Displayed as % of the total driving time. The ideal range of RPM for driving green is 750 – 1400. Driving over this set limit (or green RPM, if you like) or over-revving will burn additional fuel and cause faster engine and liquid wear. Over-revving is usually caused in vehicles with an automatic transmission where the throttle is fully depressed, forcing the engine into the higher RPM range.

As you can see in the picture above, the last four categories are fairly self-explanatory: Distance is the one driven within the set time frame, Time corresponds to the amount it took to finish said distance, Average fuel consumption is the amount burned in litres per 100 km and Average speed is, well, average speed. While unlike all the aforementioned categories, these ones aren’t marked, they could still be used to determine whether there are some imbalances in the performance of the select driver.
For example, if there appears to be a disbalance between distance driven, time and average speed, it could be the result of excessive idling or perhaps the route chosen isn’t as efficient as it could or should be. Furthermore, if there are sudden spikes in fuel consumption, it could be due to fuel siphoning and should be looked into.
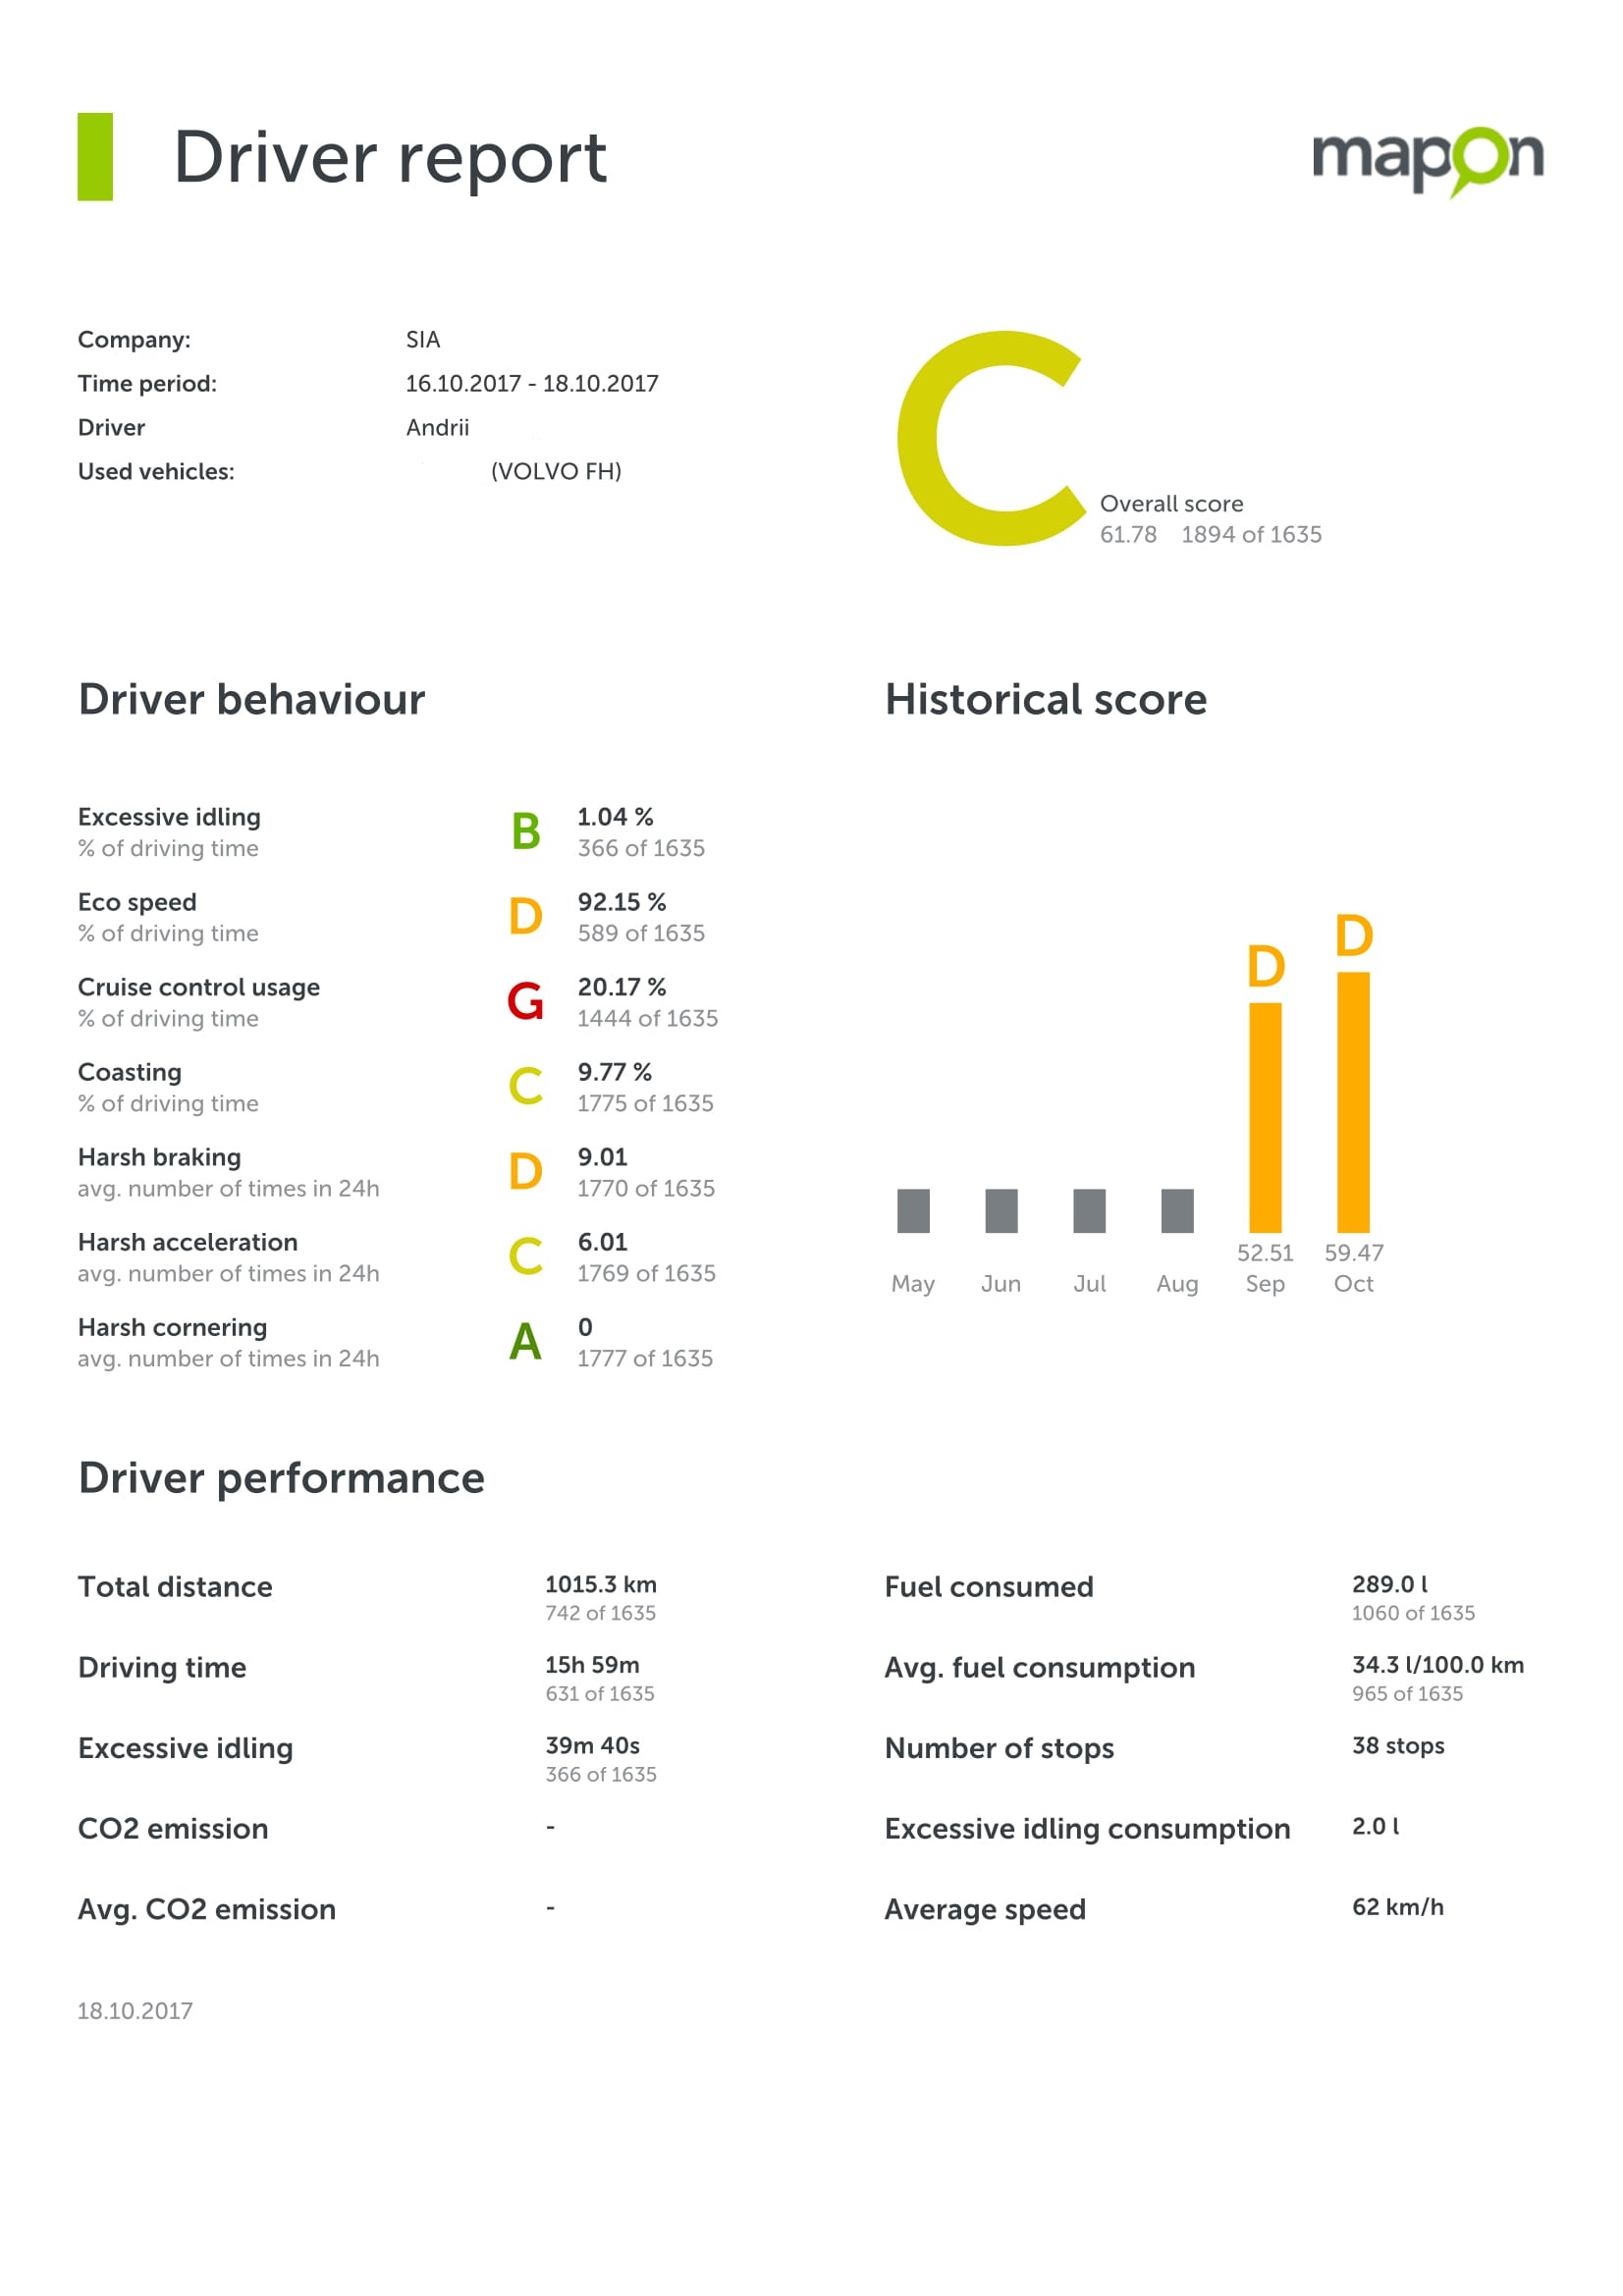
Last but definitely not least, you can create individual PDF driver reports that will show all the mentioned information on a select employee. Great for talking through all the strong and weak points of their performance to let them see what and how they could improve. Below you can see an example of how it looks in practice.


