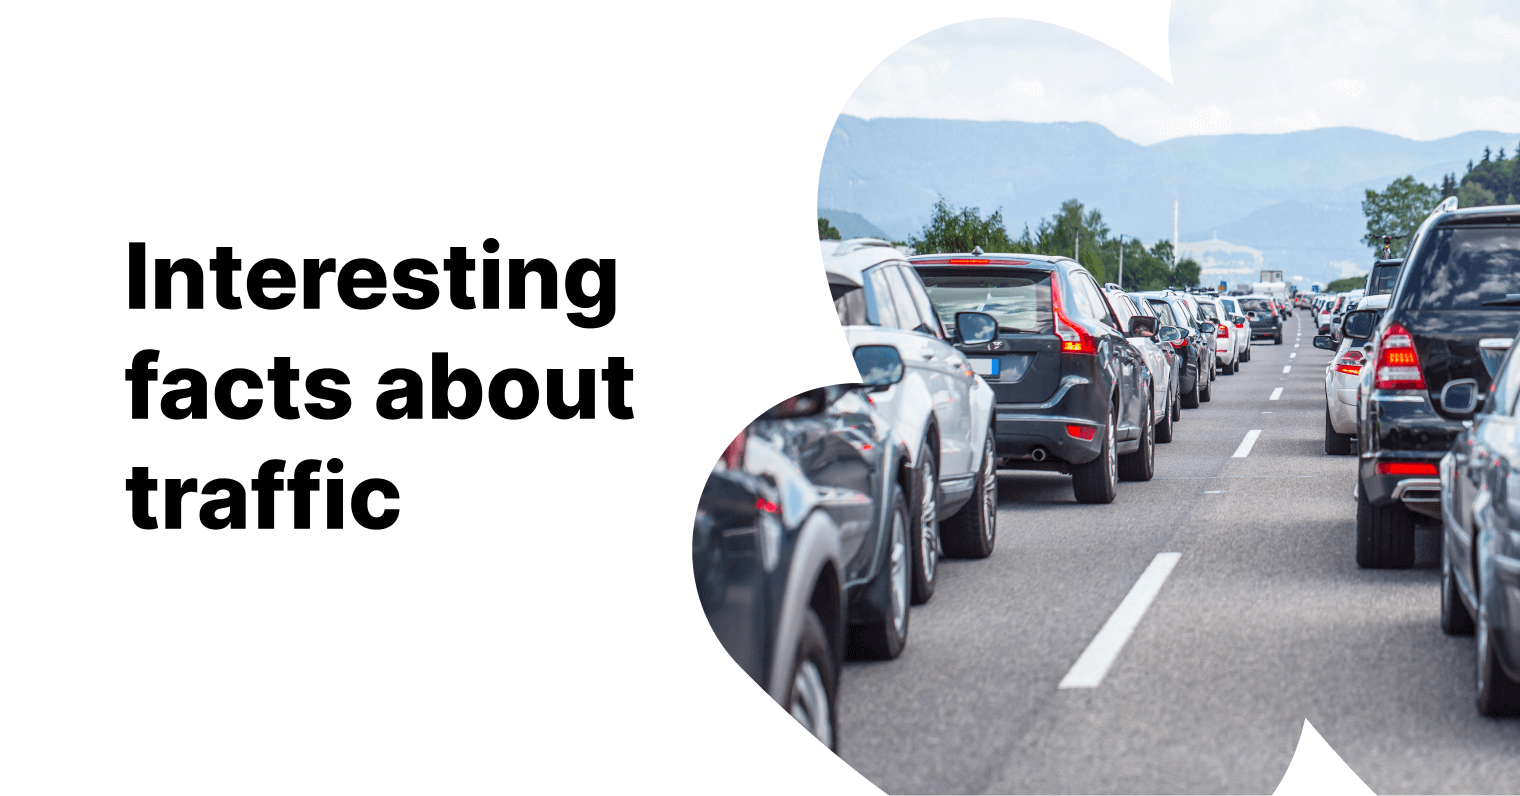
Interested in the history of traffic jams or want to read some facts about traffic in the EU or US? You have come to the right place!
We have compiled a list of interesting facts and statistics about traffic and traffic jams. Even though they’re something we encounter almost every day, there is a lot that you might not know. Read about them below or watch a video here!
General facts about traffic
1. In 2010, a traffic jam on a highway near Beijing kept cars stuck in place for more than a week (9-12 days, according to different sources). The jam went on for 97 kilometres and was caused by trucks carrying coal to Beijing. The locals sold food and water to the drivers for prices that were 10 or more times the usual.
2. Guinness World Records claims that what happened in China wasn’t the longest traffic congestion in history. They say a bigger traffic jam occurred in France in 1980, spanning 175 kilometres from Lyon to Paris. The reason – poor weather and a large number of cars on the French Autoroute.
3. The very first traffic lights were installed in the UK in 1868. They were manually operated and gas-lit.
4. The European Patent Office holds more than 5000 listed inventions relating to traffic lights.
5. In 1928, Charles Adler Jr invented traffic lights that could be activated by drivers honking.
Statistics from Europe
6. Inefficient mobility in urban areas, including traffic jams, costs the EU an estimated EUR 110 billion per year, which is more than 1% of the EU’s Gross Domestic Product (GDP).
7. Spending on transport goods and services on average accounts for 13.2% of every household’s budget.
8. Transport is the main cause of air pollution in cities and is responsible for roughly 25% of the EU’s greenhouse gas emissions.
9. In the EU, women represent only 22% of the employment in the transport sector.
10. Cars are the most popular mode of passenger transportation across the EU: they represent around 80% of the total passenger kilometres, followed by planes (~7%), coaches, buses, or trolley buses (~7%), and trains (~6%).
11. The electric and hybrid car market share amounts only to 5.7% as of 2021. The share of passenger cars is split mainly between direct injection (non-diesel) vehicles (57%), followed by diesel ones (36%).
12. The EU has more than 4.5 million kilometres of paved roads, 212 thousand km of railway lines, and 41 thousand km of navigable inland waterways.
13. Between 1995 and 2018, the EU-27, Norway, Switzerland, and the UK, invested EUR 1.5 trillion in expanding their road infrastructure. This investment was 66% higher than the one allocated to extending their railway systems.
14. From 2005 to 2050, freight transport activity is projected to increase by around 80%, while passenger traffic should grow by 51%.
Statistics from the US
15. The additional time on the road caused by traffic congression costs drivers an extra USD 869, accumulating to USD 81 billion for the whole country.
16. In the US, traffic jams result in 5.7 billion hours of delay annually.
17. If every 10th American regularly used public transportation, the US usage of foreign oil would decline by more than 40% or nearly the amount of oil imported from Saudi Arabia each year.
18. A regular rush-hour driver wastes an average of 375 litres of gasoline a year due to traffic.
19. In 1/3 of US cities, drivers spend over 40 hours annually stuck in traffic that is not moving – equivalent to an entire work week.
20. The two US cities with the highest traffic congestion are Boston and Washington D.C. with 164 and 155 hours lost per year, per driver due to congestion, respectively.
Now you know 20 more facts about traffic than before reading this article! In case you want to chat with our team about the ways how Mapon can help your fleet become more efficient, contact our Client Project Manager!
Sources:
1 – 2: Autoevolution, 2022
3 – 5: Express, 2014
6: European Court of Auditors, 2019
7: European Commission, Transport sector economic analysis
8: European Commission, Transport
9, 11: European Mobility Atlas, 2021
10: Eurostat, 2023
12: Sevilla, Chrobocinski, Barmpas, Schmidt, Kerle, Kostaridis, Doulamis, Russotto, 2020
13: Rudolph, Riach, Kees, 2023
14: European Commission, Transport Facts & Figures
16 – 19: Geography All the Way, 2008
20: Inrix

