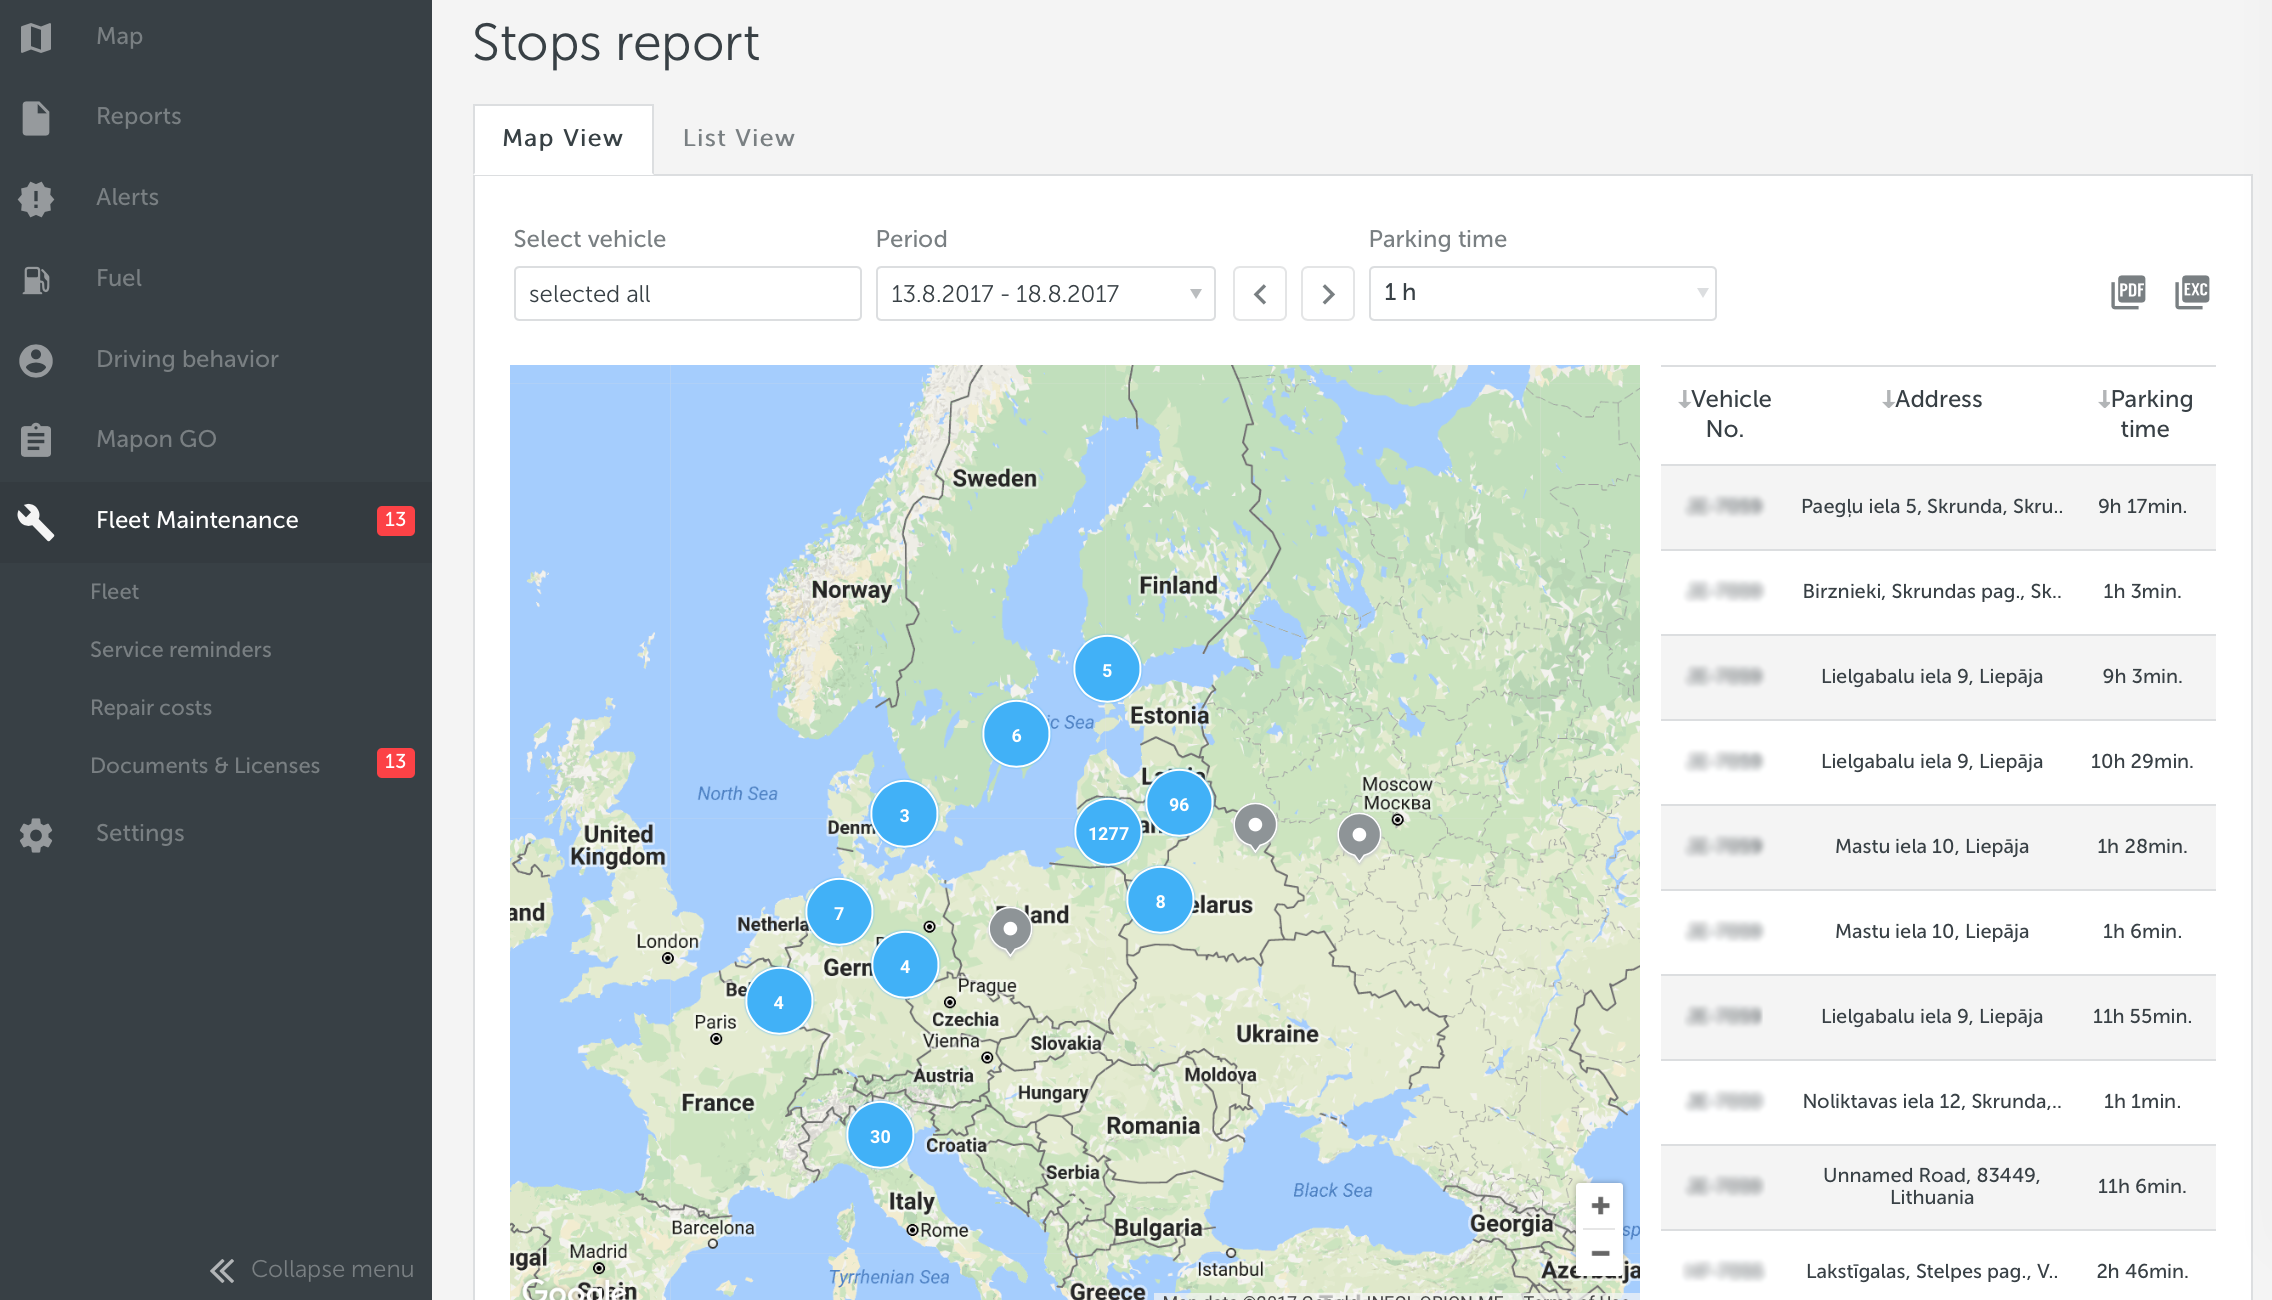
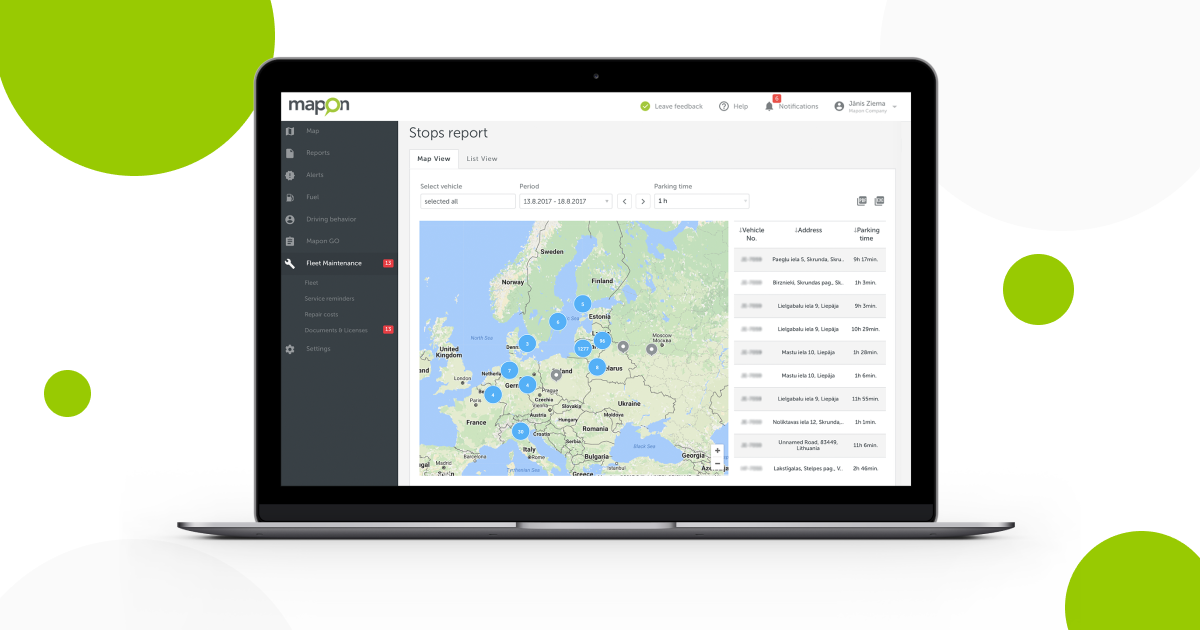
This week we launched a new addition to one of Mapon reports – Stops report. Previously, You could find a summary about all Your fleet’s vehicle stops. You could select a specific data range and vehicles, and the information would be then displayed in a simple list view.
This week we added a new section to the report. It’s called “Map View”. We haven’t removed the list view as it is very useful for many of our clients, however, we felt that the report could be brought to a new level by adding a visual map section showing all the stops in customizable data range.
This can be used in many ways. Let’s look at some of the best use cases how some of our clients are already using this new map view.
Expansion strategy
With increasing list of clients and partners, there often comes a time when the company needs to expand its operations and open a new office or service center. The planning and analysis for the perfect next location can be a rather difficult and time consuming task. New map view section is extremely helpful in identifying the busiest locations where Your fleet vehicles are stopping the most. For example, if You are looking for the best place for Your next logistics center, it will be wise to look for a place where most of Your clients or important partner companies are located at – where Your vehicles are stopping the most. If You have catering company with Your own delivery service, the new map view would help to identify a region with most clients (delivery vehicle stops). This information can then be used to decide on the best region where to open Your next cafe.
Marketing strategy
If You are not planning to open an additional branch or business center, You might be still interested where most of Your clients are located at. The map view section can help to identify the region with the most clients. This information can be used, for example, to adjust Your advertising budget and focus more on regions with the most clients. Or just the opposite – find a new region where You don’t have that many clients, to identify the best place for marketing campaigns and business expansion.
Identifying issues
If a vehicle is standing in one place for too long, it can cause Your company loss. Stops report can be used to find vehicles that are standing on place for the longest time period. Map view will help to identify exact locations that You should pay attention to. For example, it can help to find clients at whom Your vehicles are spending most of the time. One of the reasons could be that Your client’s logistic center gets very busy during certain business hours, as of result, the unloading process takes more time than it should. This information can then be used to improve the route and task planning, which will save You time and resources.

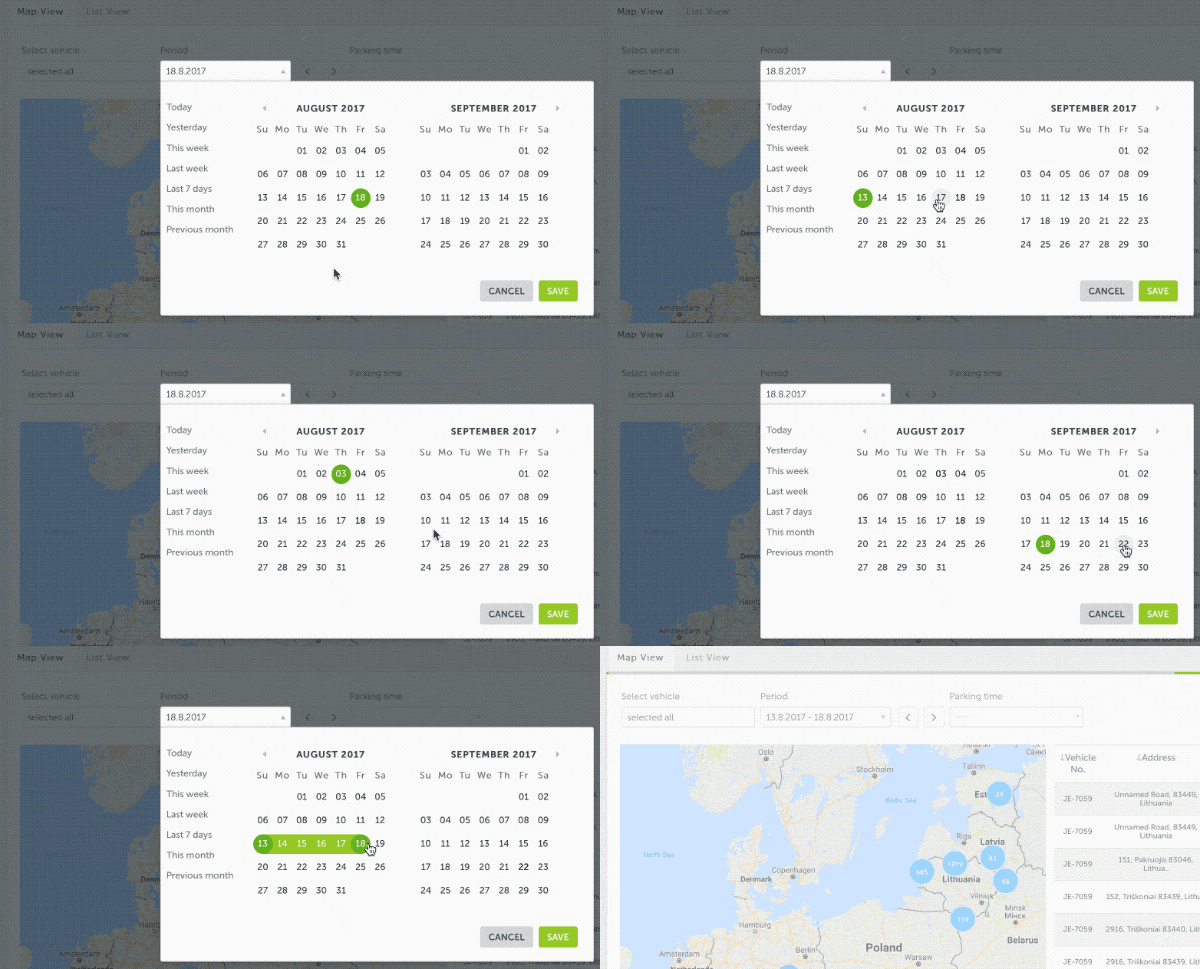
Improved custom time interval picker
We have also updated the date picker interface. The main options have not changed, however, the new picker helps to select custom date interval quicker and displays the selected range in clearer way. From now on it should be less confusing.


