How to effectively manage fleet fuel consumption?
Managing fleet fuel consumption is one of the most important issues for any transport company, as fuel accounts for a large part of fleet maintenance expenses. Using high-quality fleet fuel management software and hardware is essential in getting accurate fuel consumption data and being able to make informed fleet management decisions, thus we’ve written this post to explain what equipment can be used to track fuel consumption and why you should choose one or another.
Nowadays, businesses can control fuel consumption efficiency by using various types of equipment, such as:
- Standard fuel level measurement data – the vehicle CAN bus.
- Fuel consumption sensor.
- High-capacity fuel level sensor.
Fuel control using CAN bus is the most suitable option for light vehicle fleets, while fuel consumption and fuel level sensors would be the best fit for transport companies that operate with trucks and other heavy vehicles or refrigerated trailers.
Let’s look at what advantages and disadvantages each of them has.
Managing fleet fuel consumption with CAN bus
CAN bus is installed in most modern light vehicles, trucks and tractors and is used to send information about the fuel level from the vehicle’s on-board computer to the satellite monitoring system. The on-board computer, however, receives the fuel-related data from a sensor that’s installed in the fuel tank by the vehicle manufacturer.
The GPS tracking device must support the CAN interface in order to receive the data from the CAN bus. Then, by using a safe-to-use contactless reader that doesn’t impact the wire isolation, integrity and manufacturer’s warranty, it can be connected to the vehicle’s CAN bus. This allows you to get a wide range of different data on the operations of almost any vehicle that has a CAN bus.
The most obvious benefit of choosing this option is that it saves you on installation and maintenance costs compared to fuel consumption and fuel level sensors.
Besides, CAN bus can provide information not only about fuel consumption but also parameters like engine speed, coolant temperature, oil pressure, etc.
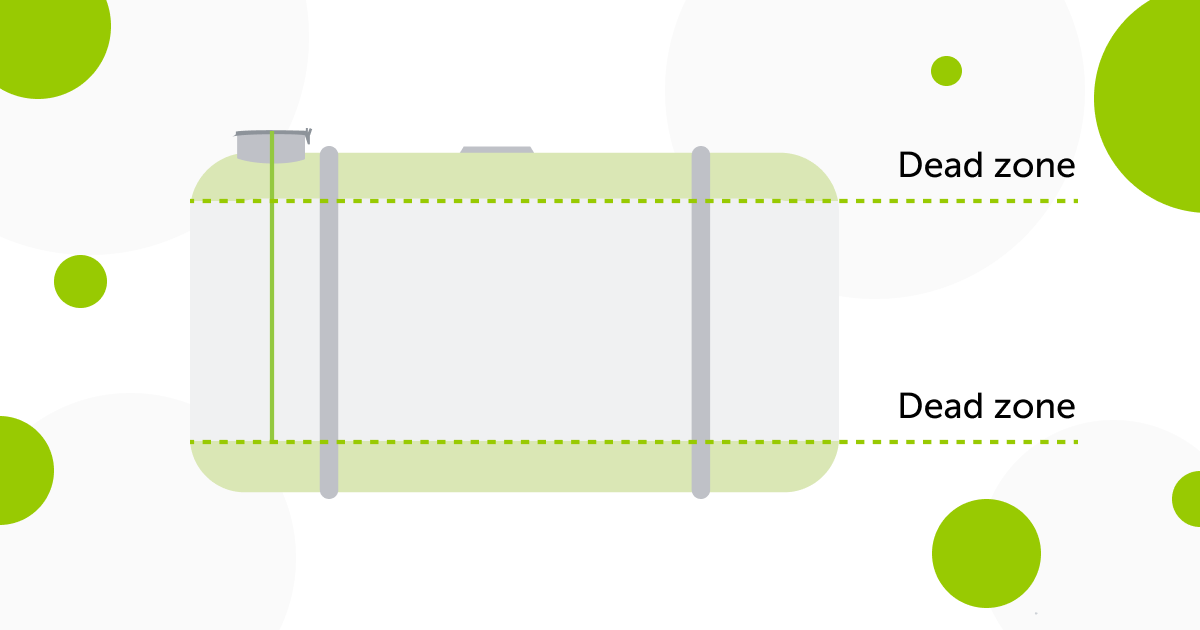
The main disadvantage is the built-in fuel level sensor itself. Our experience shows that it may have an error of up to 15%. Moreover, this error percentage doesn’t include the dead zones in the upper and bottom part of the tank, that can take even up to 10% of its volume, thus increasing the error even more. Another issue is that the average fuel consumption calculation by the on-board computer is tied to the vehicle mileage that’s read from the odometer that itself has an error of 5-7%.
Fleet fuel management using fuel consumption sensors
Fuel consumption sensor is installed on the vehicle’s fuel line and measures the volume of fuel that’s passing through it. It’s also called the fuel flow meter. There are two types of such sensors – single-chamber and differential. To illustrate how it works with a more common example, you can compare the fuel consumption sensor with a water meter that everyone has at home. The data from the sensor is transmitted directly to the GPS tracking device as shown in the picture below.
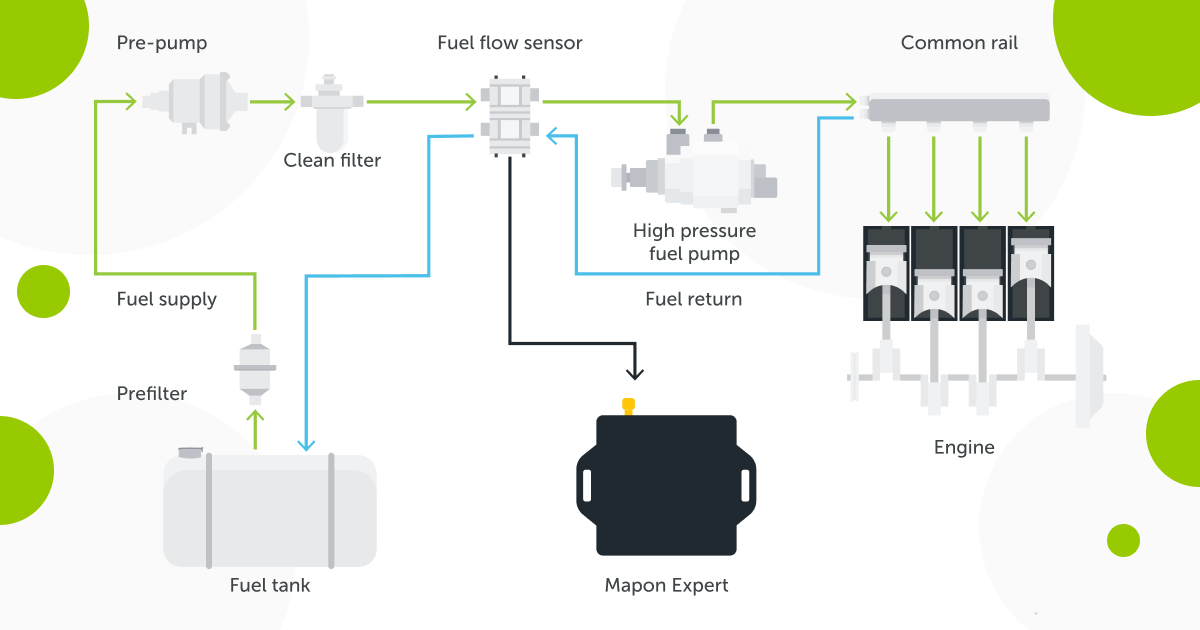
These types of sensors are very common in railroad, air and water transport, additional vehicle equipment that’s mounted on the chassis, or stationary installations. However, we, at Mapon, don’t install these sensors but choose to work with fuel level sensors that you’ll read about further in this post. The reasons for that are:
- The fuel flow meters get dirty fast and paraffinize in winter. It happens because the sensor’s vane system is the bottleneck of the fuel line and getting dirty may result in fuel flow to reduce or even stop. This, in turn, can cause loss of power, equipment breakdown or downtime.
- Difficult installation.
- The sensor and installation cost two times more than the fuel level sensor.
- Sensors can’t be used to track the date and location of refills and drainages. It means that you’ll be able to spot possible drainages by looking at the consumption metrics, but you won’t see when and where they happened.
- Installing these sensors requires interference with the vehicle’s fuel system, thus in case it still has a warranty, after installation it won’t apply to the fuel system anymore.
Fuel consumption tracking using fuel level sensors
This is a high-capacity sensor that measures the fuel level and its changes in the tank (refills and drainages). The fuel level sensor connects to the GPS tracking device via digital output.
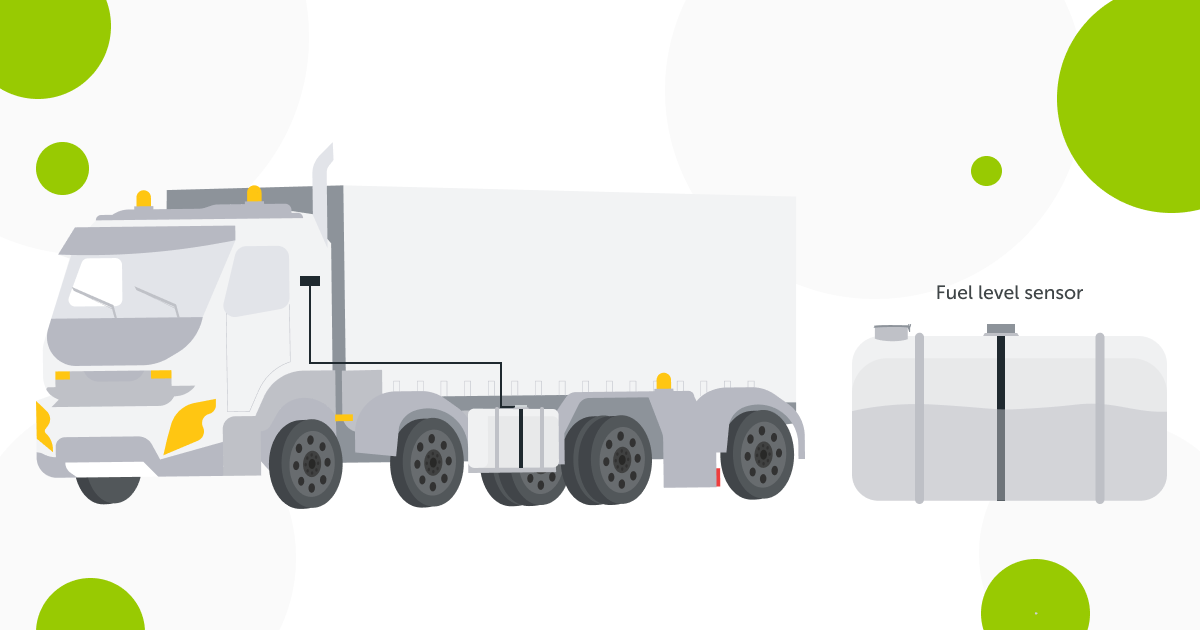
If the sensor is correctly installed, its error will only be from 1-2%. However, you should be aware that external factors, such as switching to a different fuel, may increase the error percentage.
Fuel level sensors are known for being more precise than other fuel consumption tracking devices. They’re also less affected by impulse interference. In our fuel consumption monitoring system, measurements are shown as:
- Data about the fuel level at the beginning and the end of the trip or a specific period of time;
- Easy-to-read fuel consumption graph;
- Information about the date and location where the refills and drainages happened;
- The number of drainages and the drained volume.
Based on this information, the system calculates the average fuel consumption per 100 km.
Field experts say that measuring the fuel consumption by using modern sensors provide businesses and fleet managers more information, as well as accurate and easy-to-use data about the fleet fuel consumption.
In fact, using the fuel level sensors is currently the most effective way how to track fuel consumption.
Of course, there are also certain challenges that come with using the fuel level sensors, for example, in a situation when the vehicle operates on an uneven surface, such as a quarry.
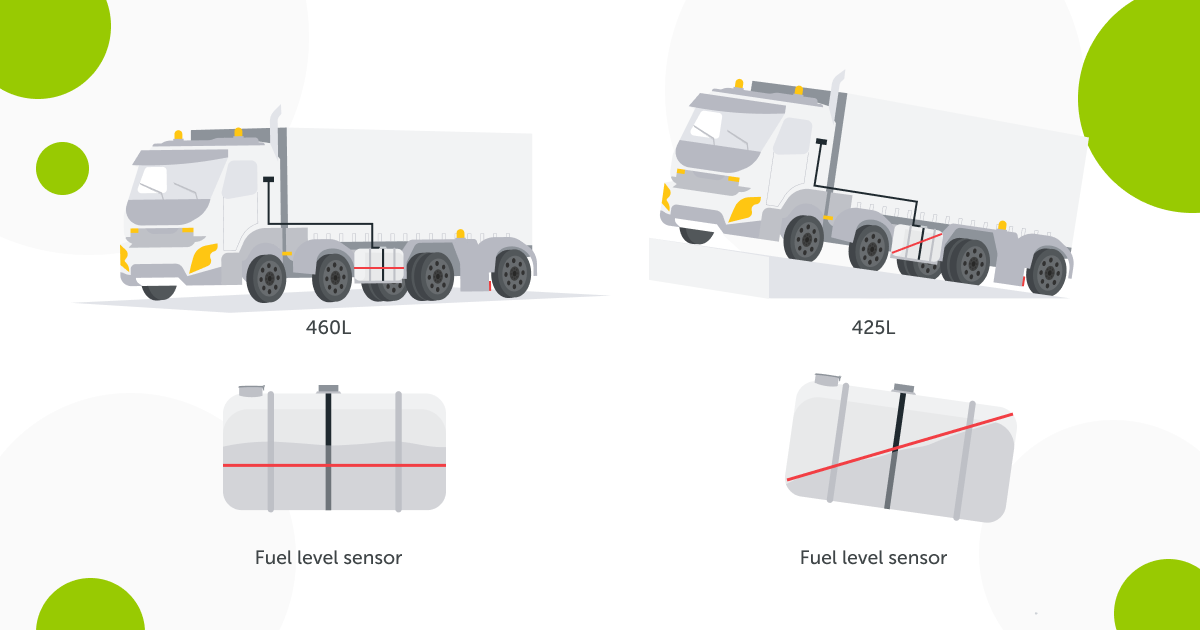
Below, you can see how a fuel graph looks in such a scenario. The fuel level is fluctuating due to uneven surface, driving up the steeper slopes, etc.
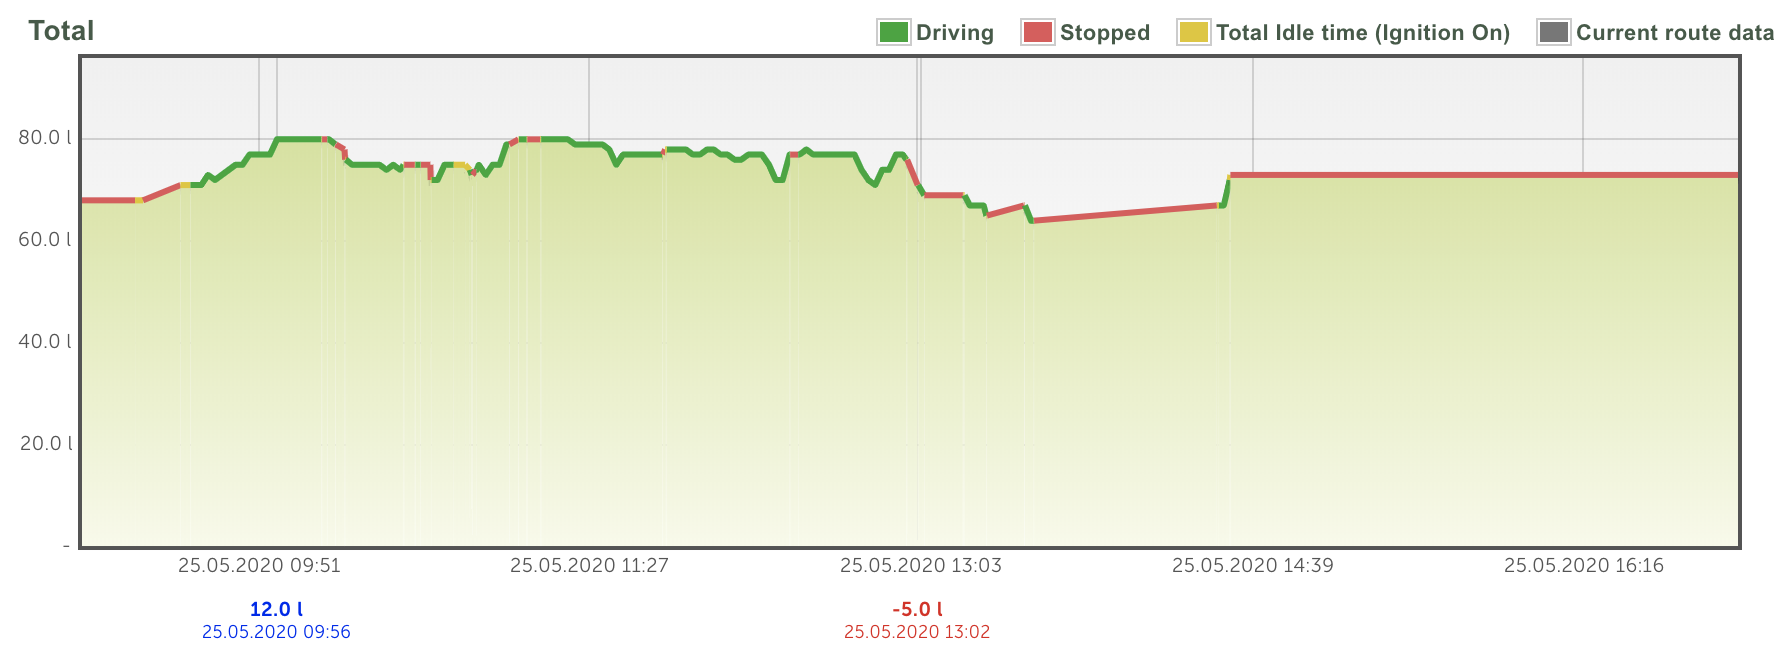
In the Mapon fleet management software, data from such situations are smoothed and filtered out as much as possible to provide you with the most accurate data possible. To receive the most precise data about the average fuel consumption, it’s important to look at the weekly or monthly reports.
Keeping track of fuel drainages
The methodology for determining drainages relies on building fuel reports for a certain period of time, starting from one day. If the reports show data on drainages, you should analyse them. Here are a few examples on how to determine, whether drainage has actually happened:
1. Learn whether it’s false drainage by looking at the time when it happened
For example, if the drainage has started at 12:45:36 and ended at 12:45:46 or 12:45:56, most likely, it was the jump in the fuel level caused by working in a quarry, specifically, driving up and down the slopes, uneven surfaces, etc., thus should be considered false. The fuel consumption monitoring system filters out such events as much as possible, but they can sometimes occur if the vehicle operates in intensive work conditions.
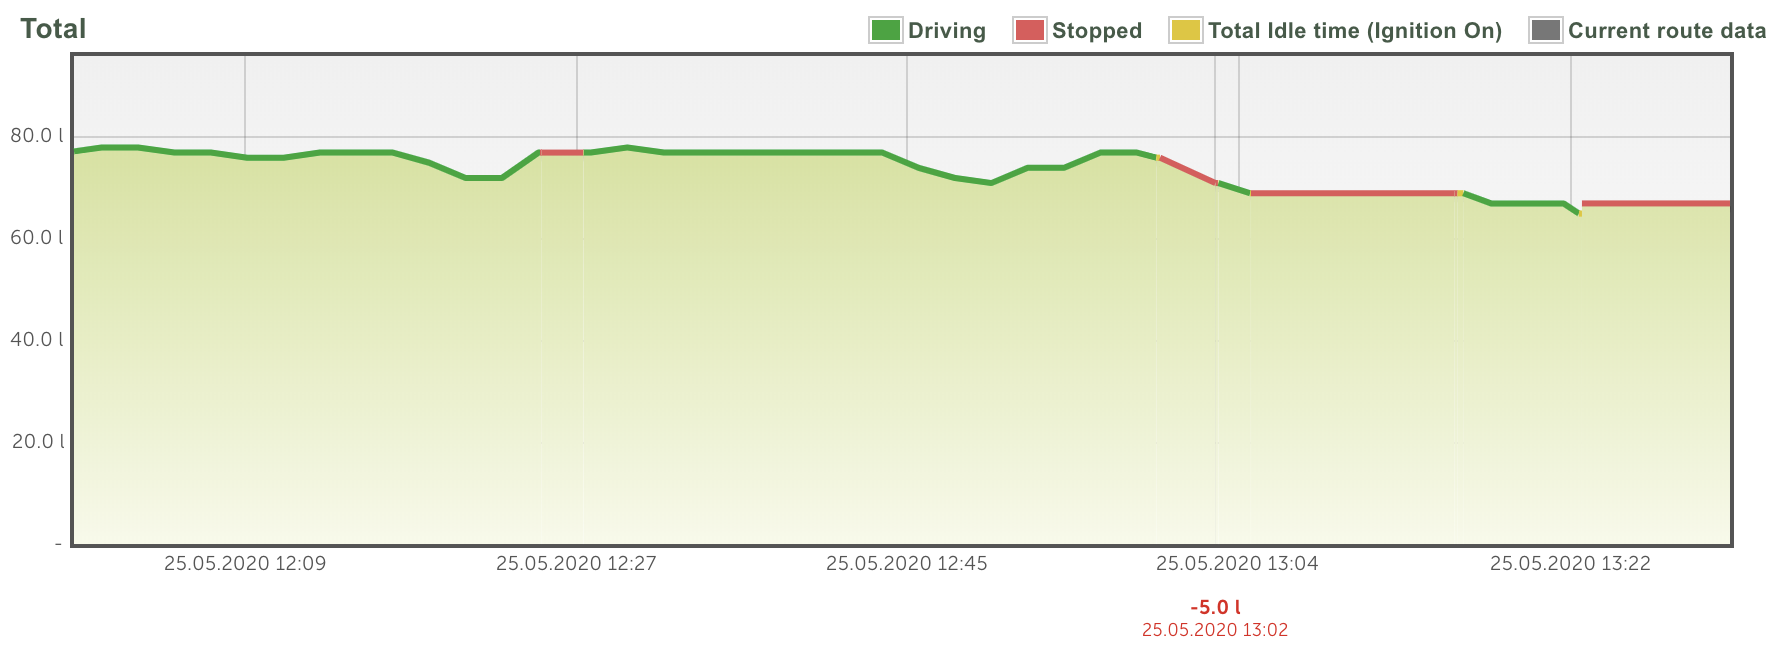
2. A drainage that is longer than 30 seconds
If a drainage is longer than 30 seconds, you should at first look at the mileage graph and then – at the time graph. They will show whether during the trip the fuel volume after the drainage returned to approximately the same level as before drainage. For example, if there were 67 litres in the tank before the 7-litre drainage was registered, but afterwards, the graph showed that the fuel volume has returned to 65-67 litres during the further trip, the particular drainage should be considered false. If the fuel volume didn’t return to the same position, you should count this as drainage.
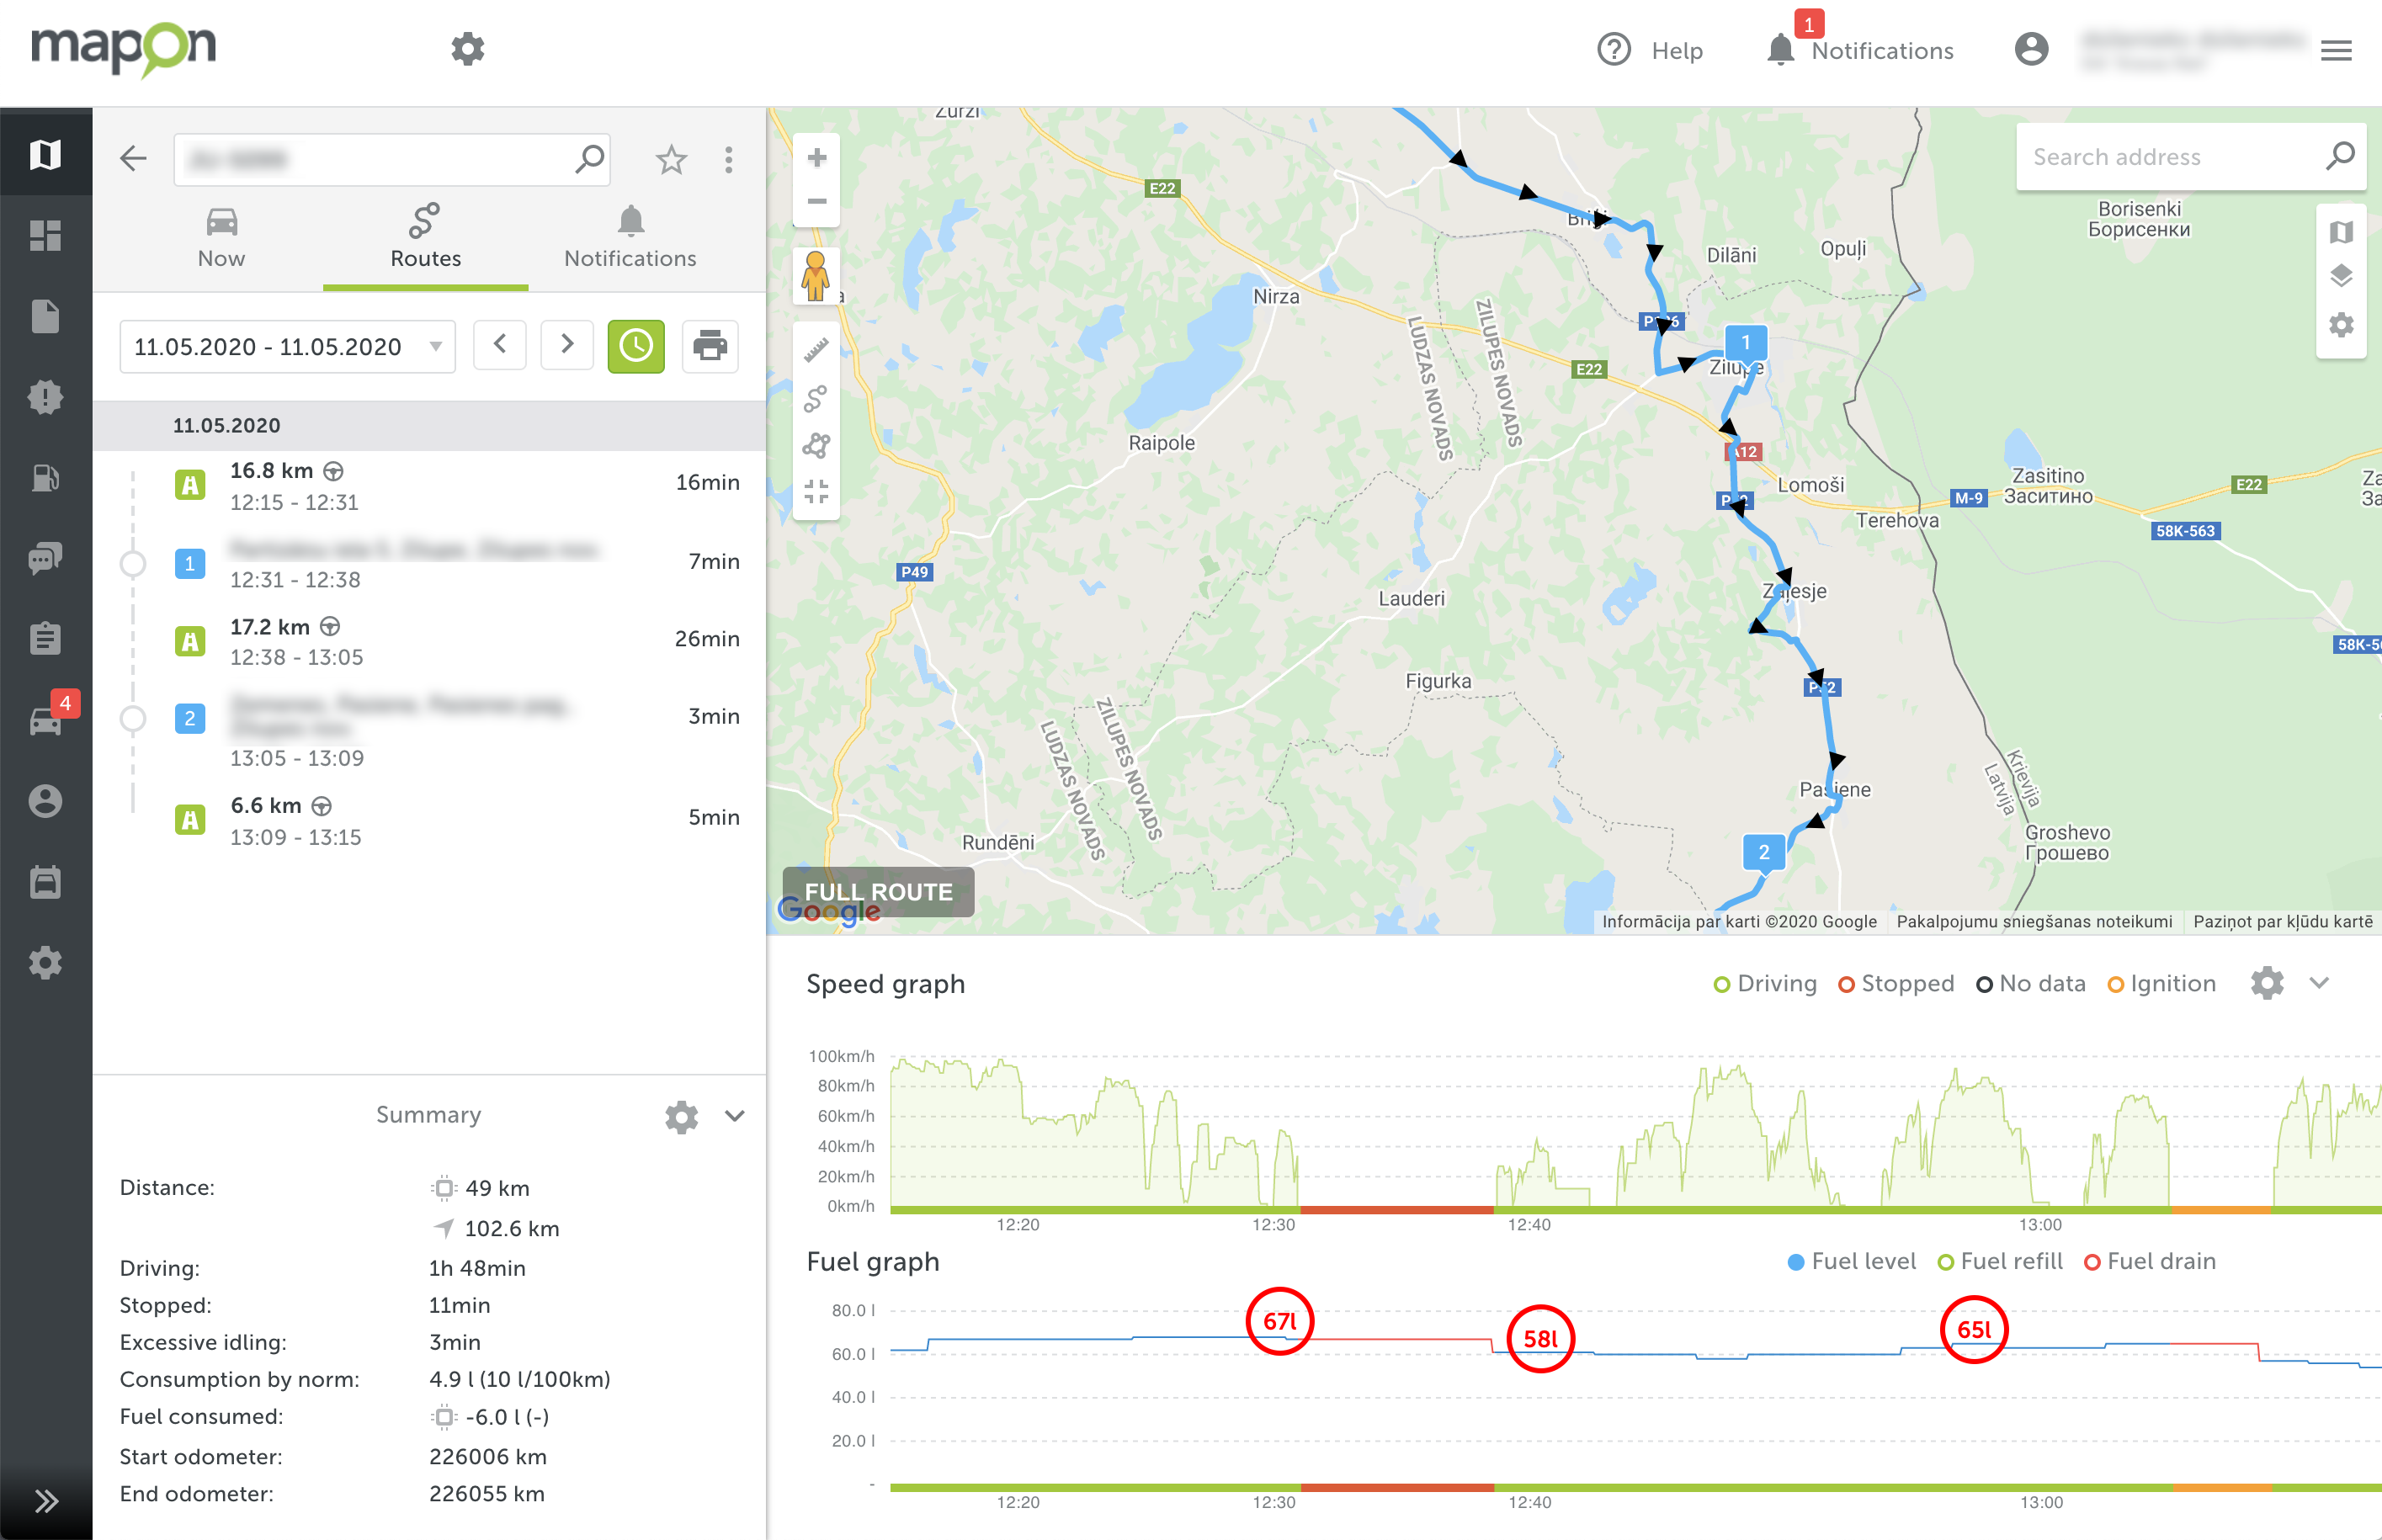
3. Check the fuel graph for an abrupt decrease in fuel volume
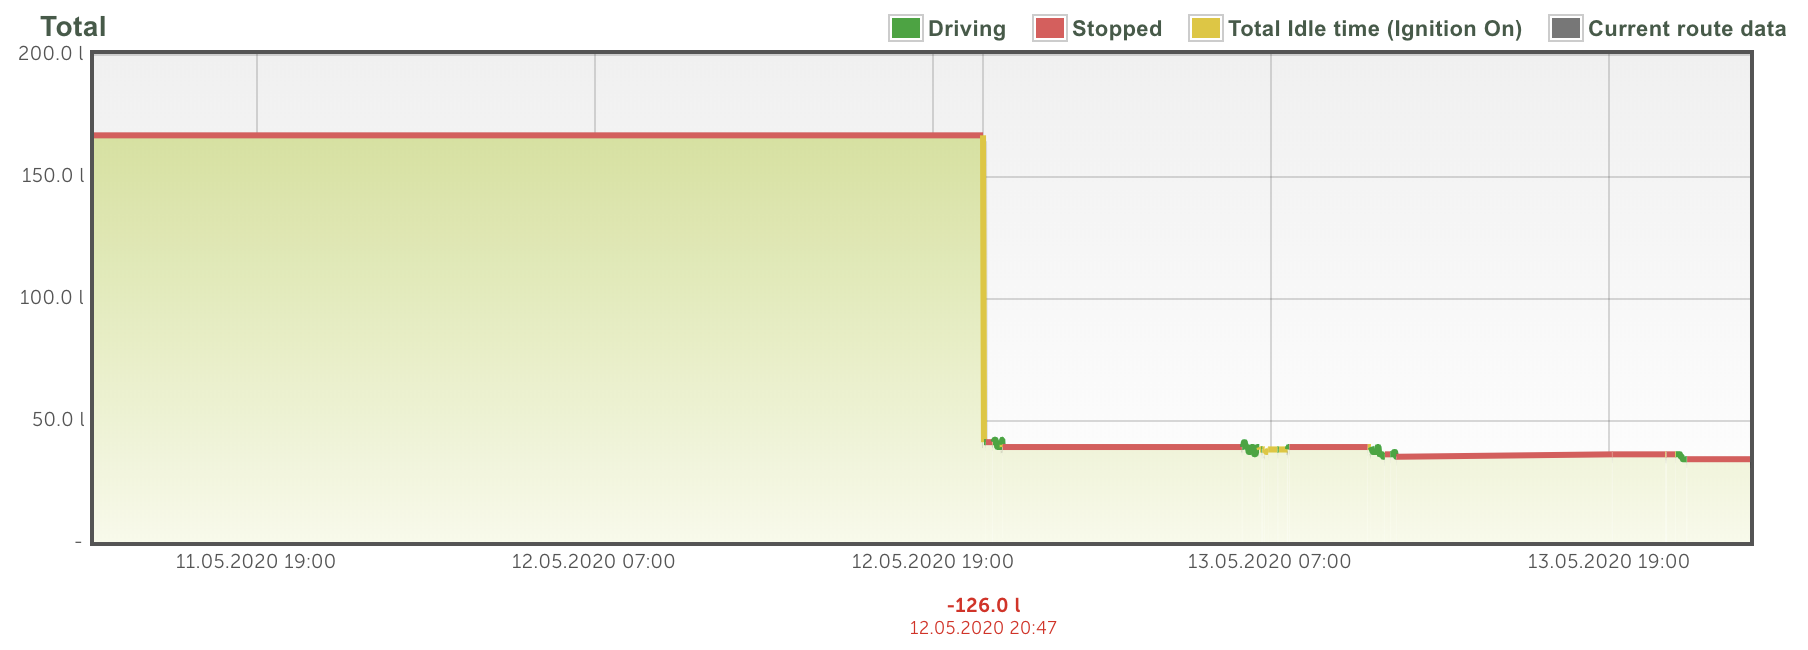
If you notice a sharp decrease in the graph and there haven’t been any trips currently, then you need to analyse this event as possible drainage. Don’t forget to take into account other factors that may impact the measurements, such as temperature changes that are always happening during the night or on sunny weather.
As you can see, there are multiple ways how to monitor fleet fuel consumption and improve its efficiency. Our team is willing to work out the best solutions for you, based on your business needs, thus don’t hesitate to learn more about fuel management systems and contact us to apply for a free consultation.


