Dashboards for a convenient overview of your fleet state
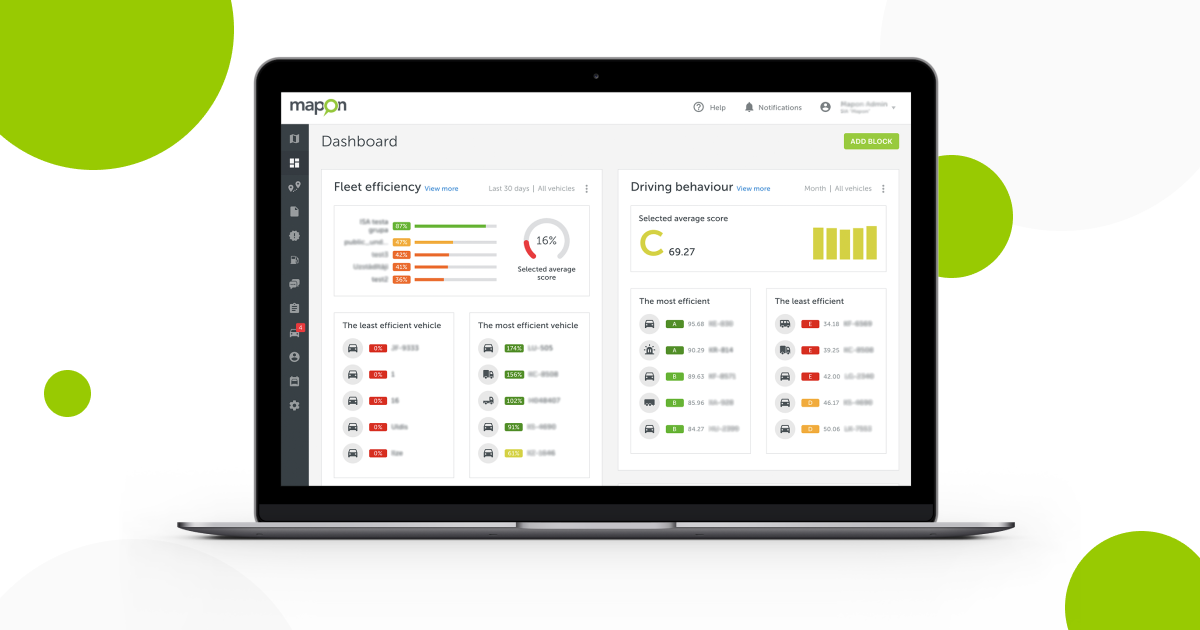
User experience is what makes customers choose one product over another. At Mapon, we strive to make our platform as easy-to-use and understand as possible, and it can only be done by taking into account what our clients have to say. Recently, we’ve got feedback that there is plenty of useful information in our system that offers a very detailed look into the state of the company fleet, but it takes a lot of time just to click through all sections and find all that data. That allowed our team to come up with Dashboards – an entirely new section that will allow you to keep track of the most important information of your fleet.
What are the Dashboards for?
Each fleet, big or small, has its own key performance indicators (KPI) that show whether its current state meets the company goals or not.
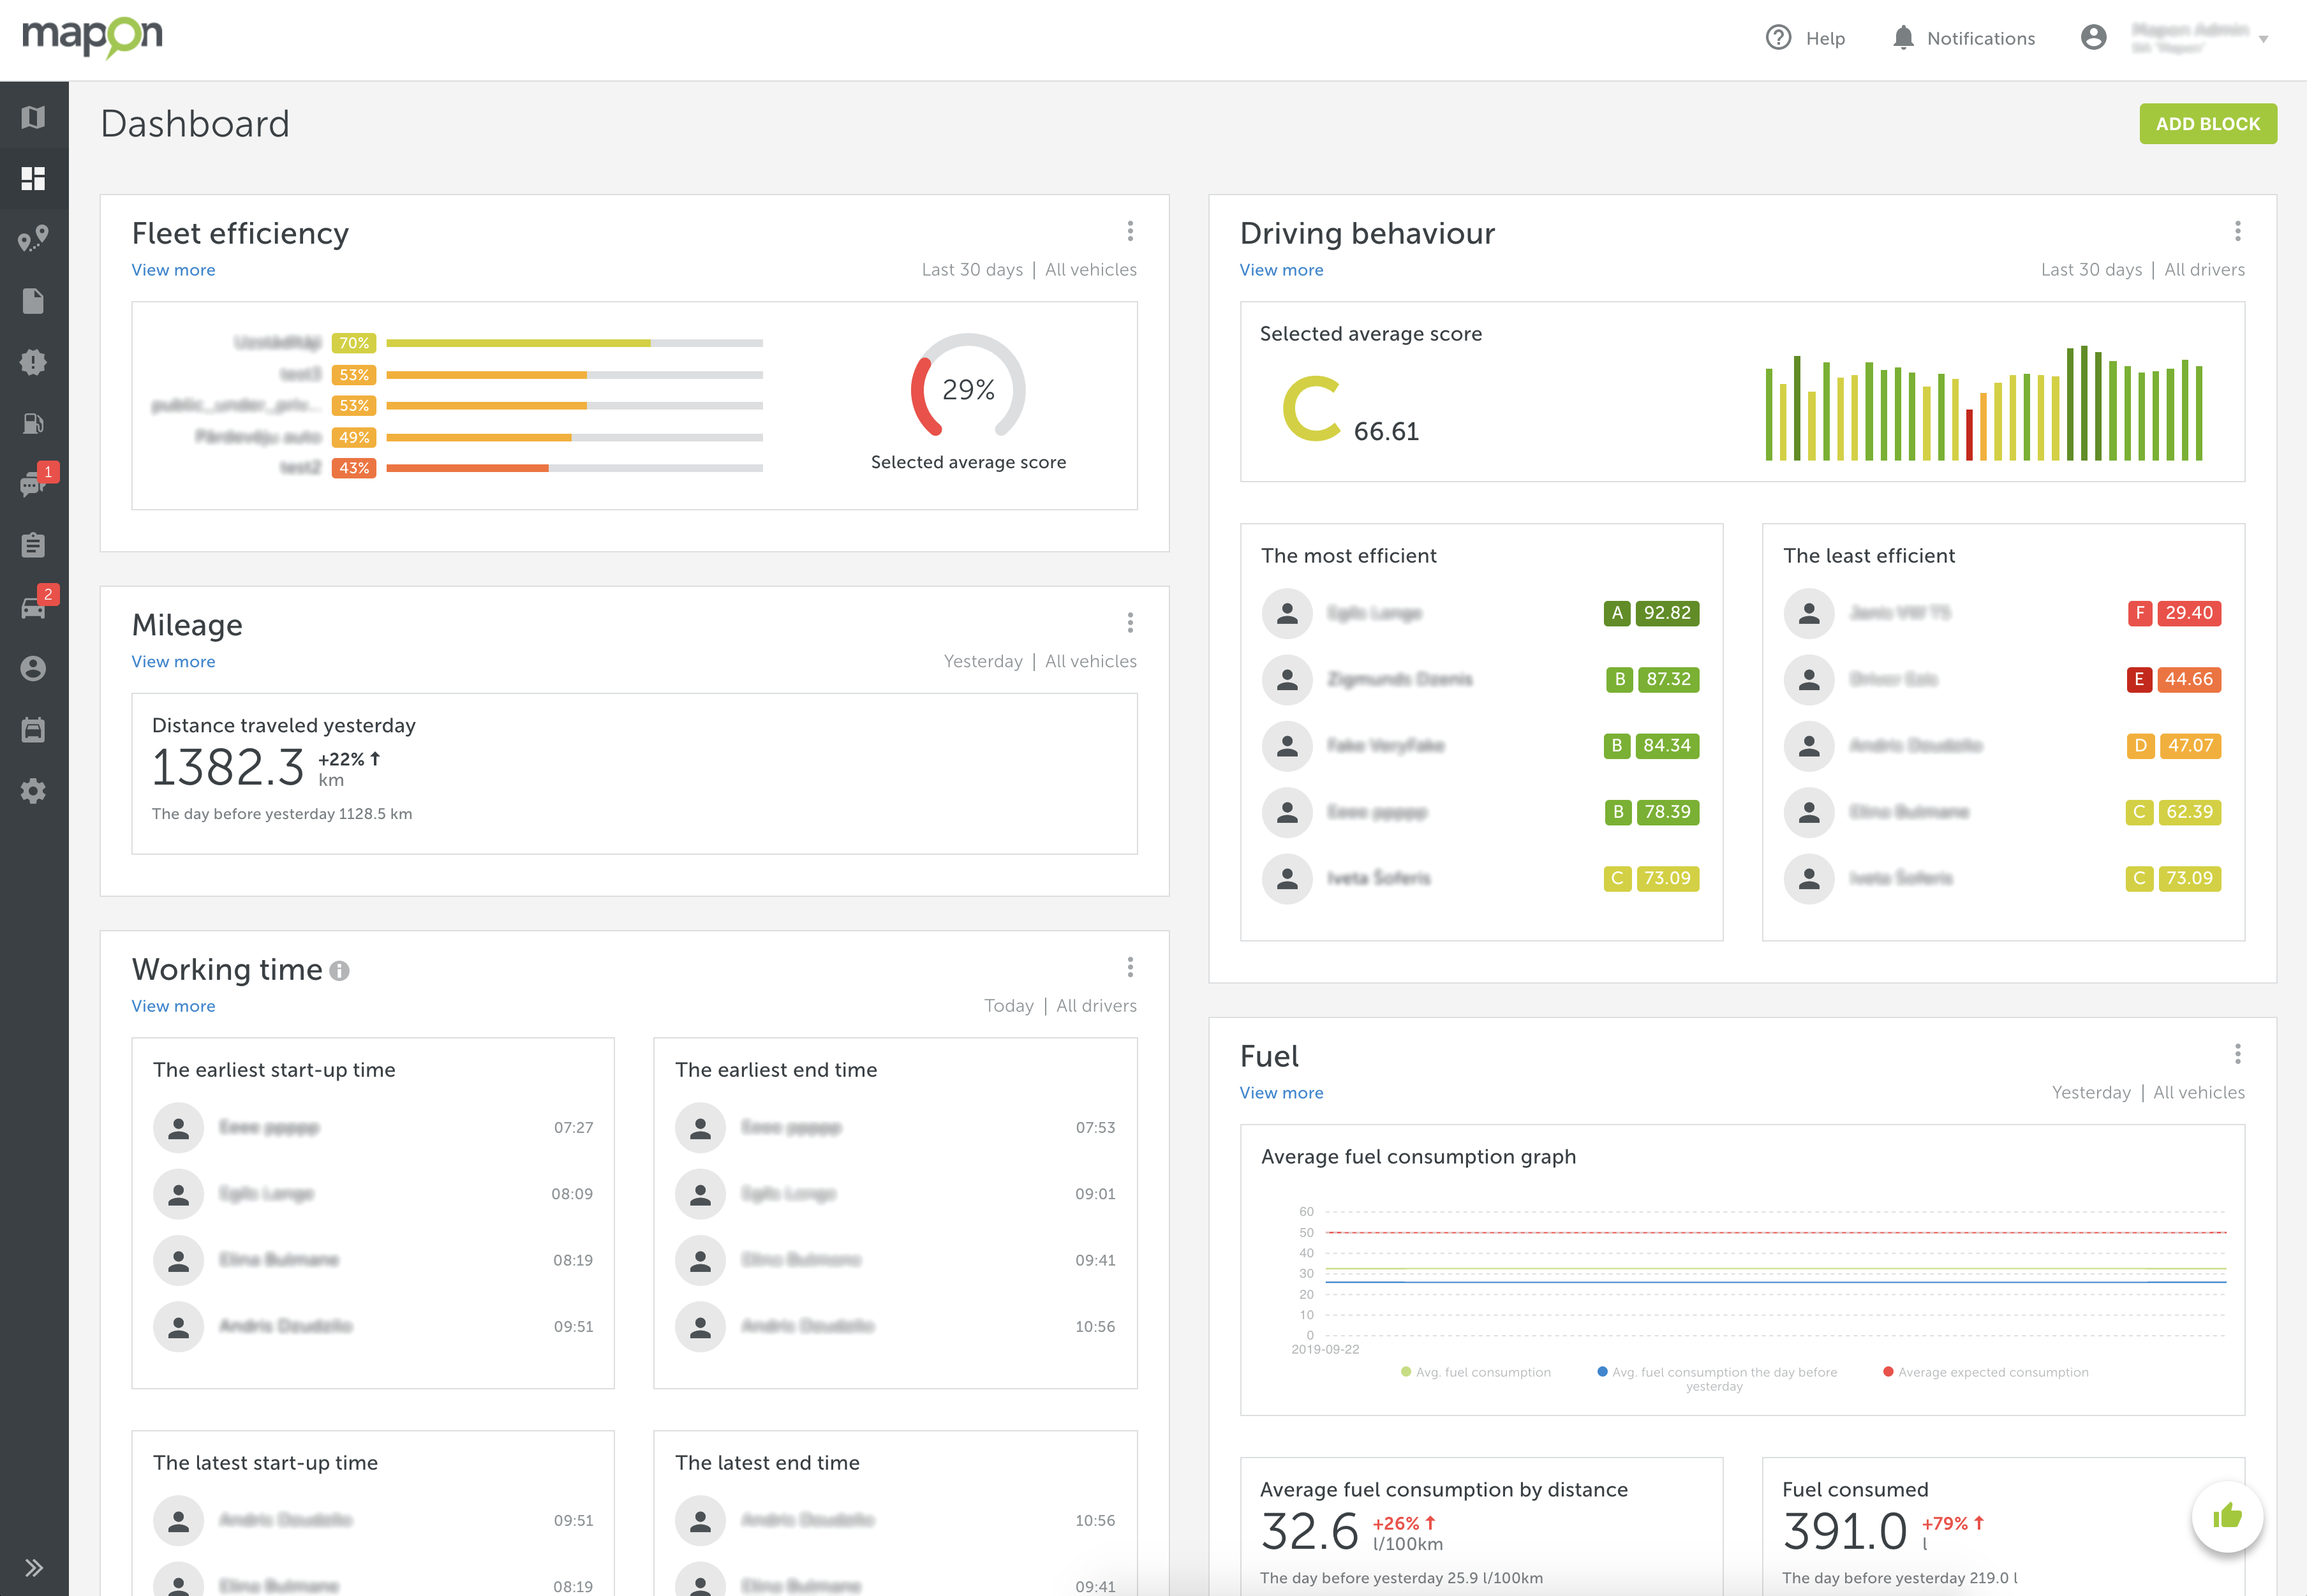
Dashboards are created to offer you a quick insight into how your fleet is performing and help identify any possible issues.
They serve as an overview, providing the TOP5 results for each of the metrics placed in the Dashboards.
There’s also an option to dig deeper into the data by pressing on the View more button under the name of each block.
5 configurable information blocks
Currently, Dashboards have five different information blocks for you to use:
- Fleet efficiency
- Driver behaviour
- Daily mileage
- Fuel
- Working hours
Each of the blocks has several modules you can use by adjusting their settings to get exactly the information you want.
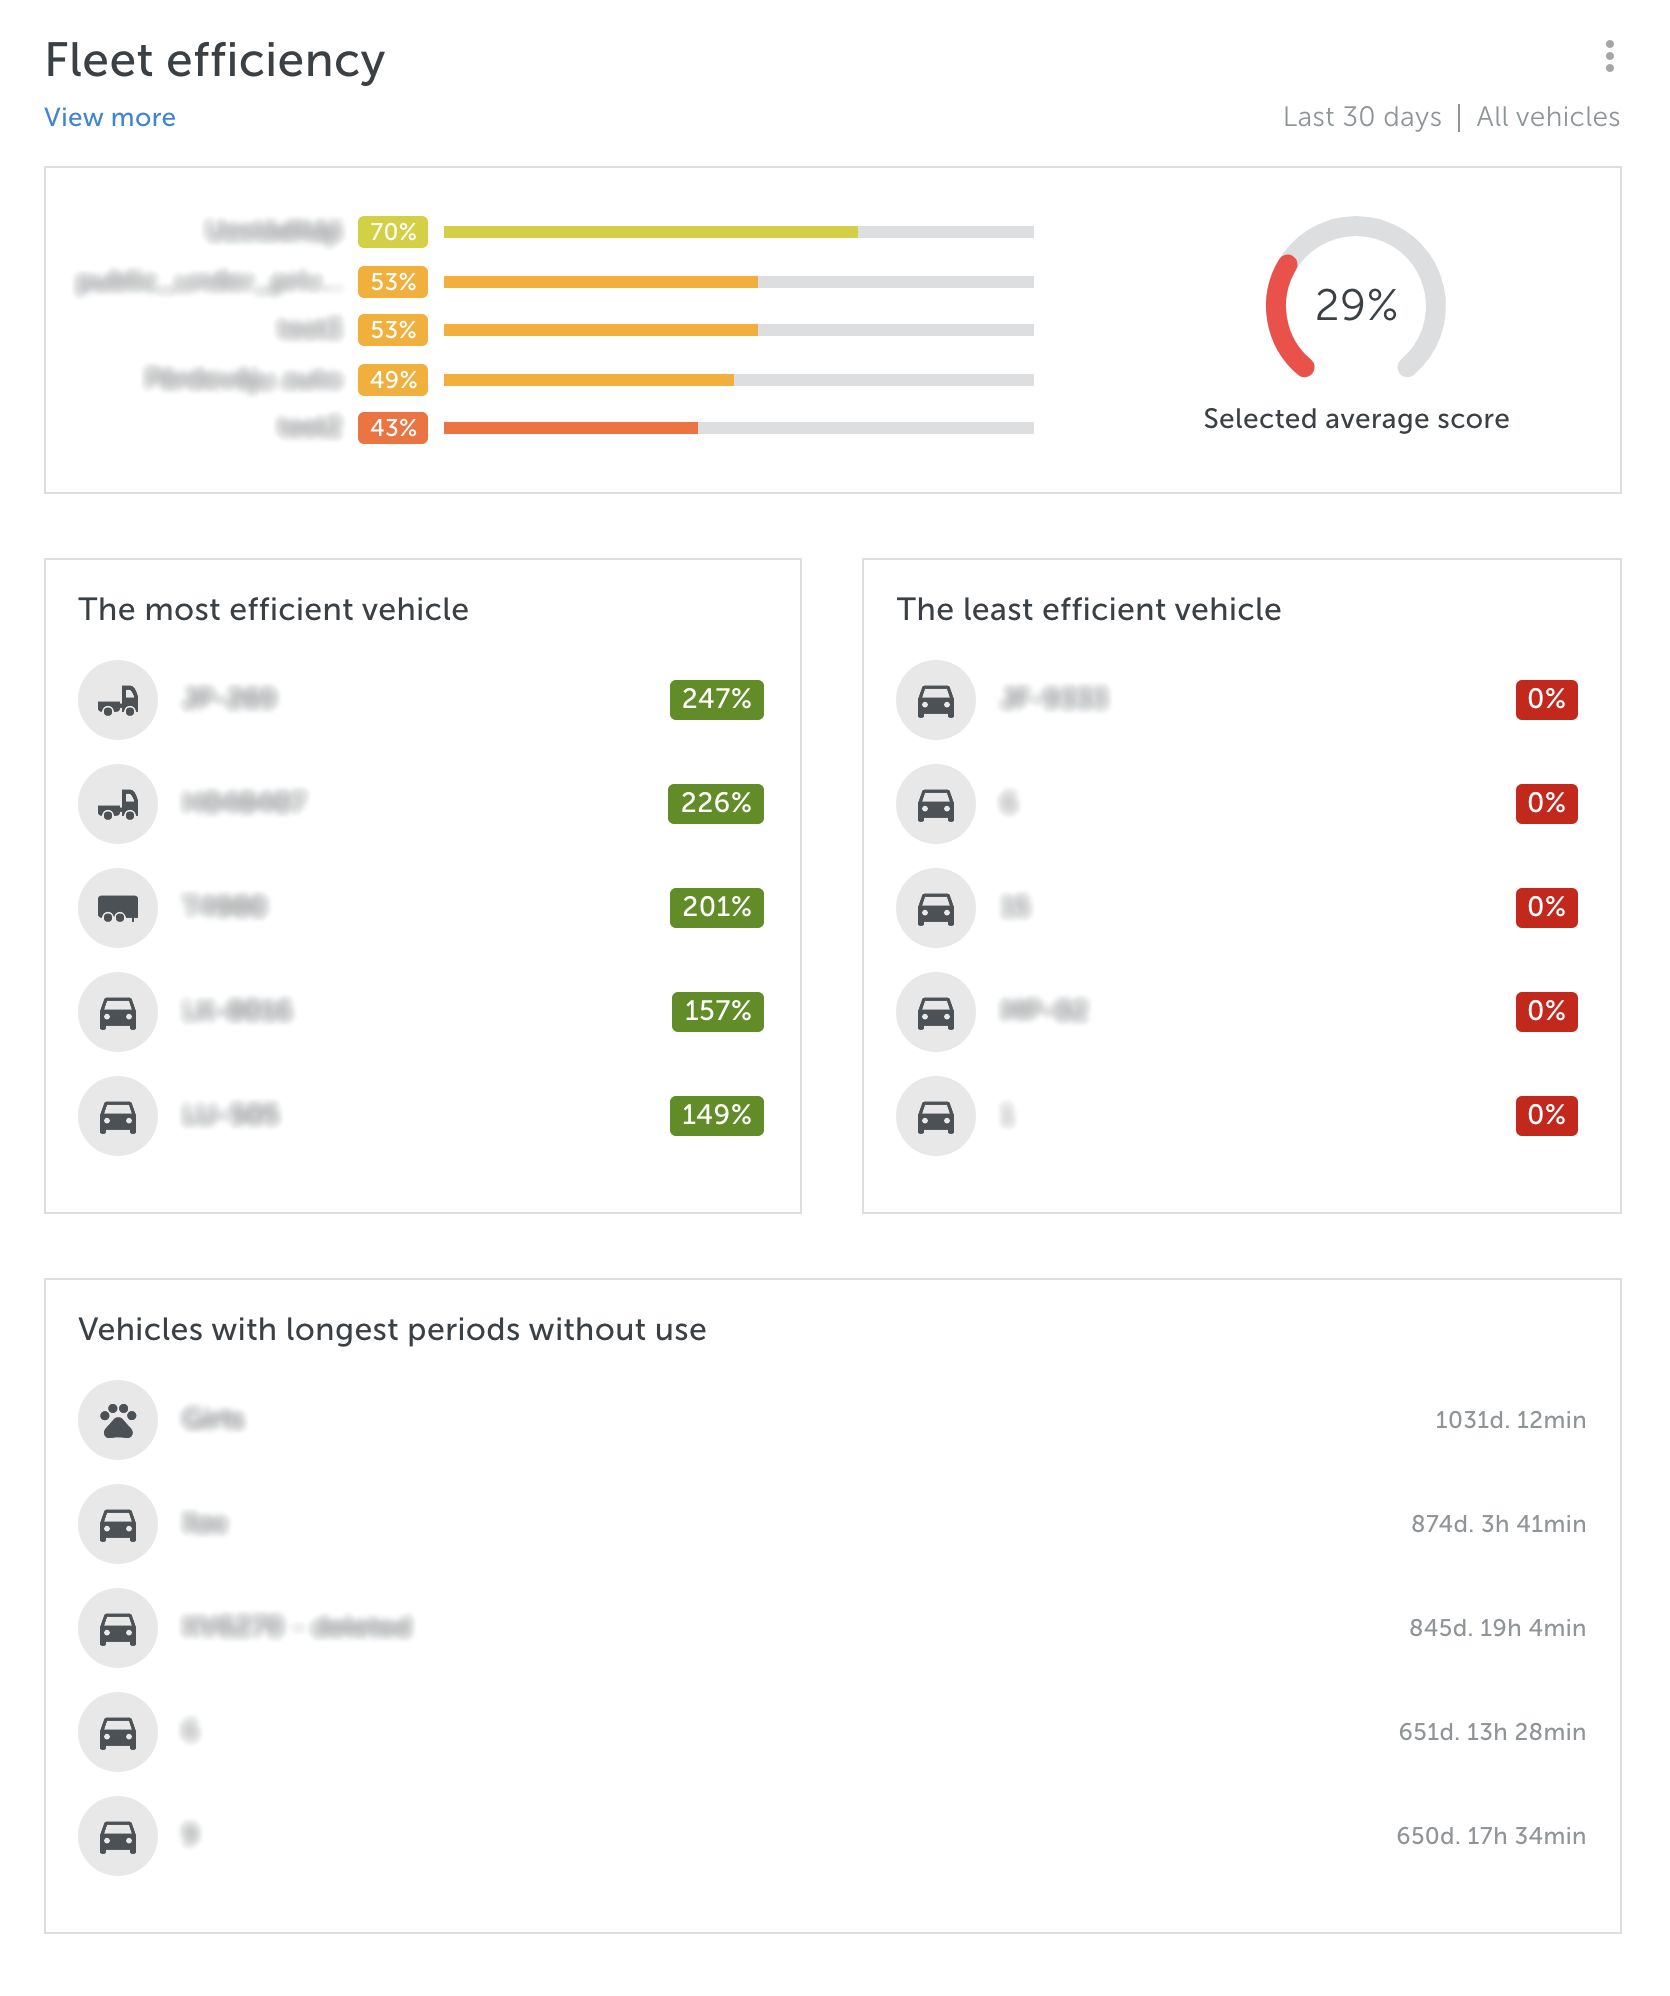
Fleet efficiency
Fleet efficiency is a snapshot of the company fleet state on a specific date. In Dashboards, this information is divided into four modules, showing the overview of the fleet efficiency for all your chosen vehicle groups, as well as the TOP5 of the most and the least efficient vehicles and vehicles with the longest period without use – a metric that is calculated by the ignition off time.
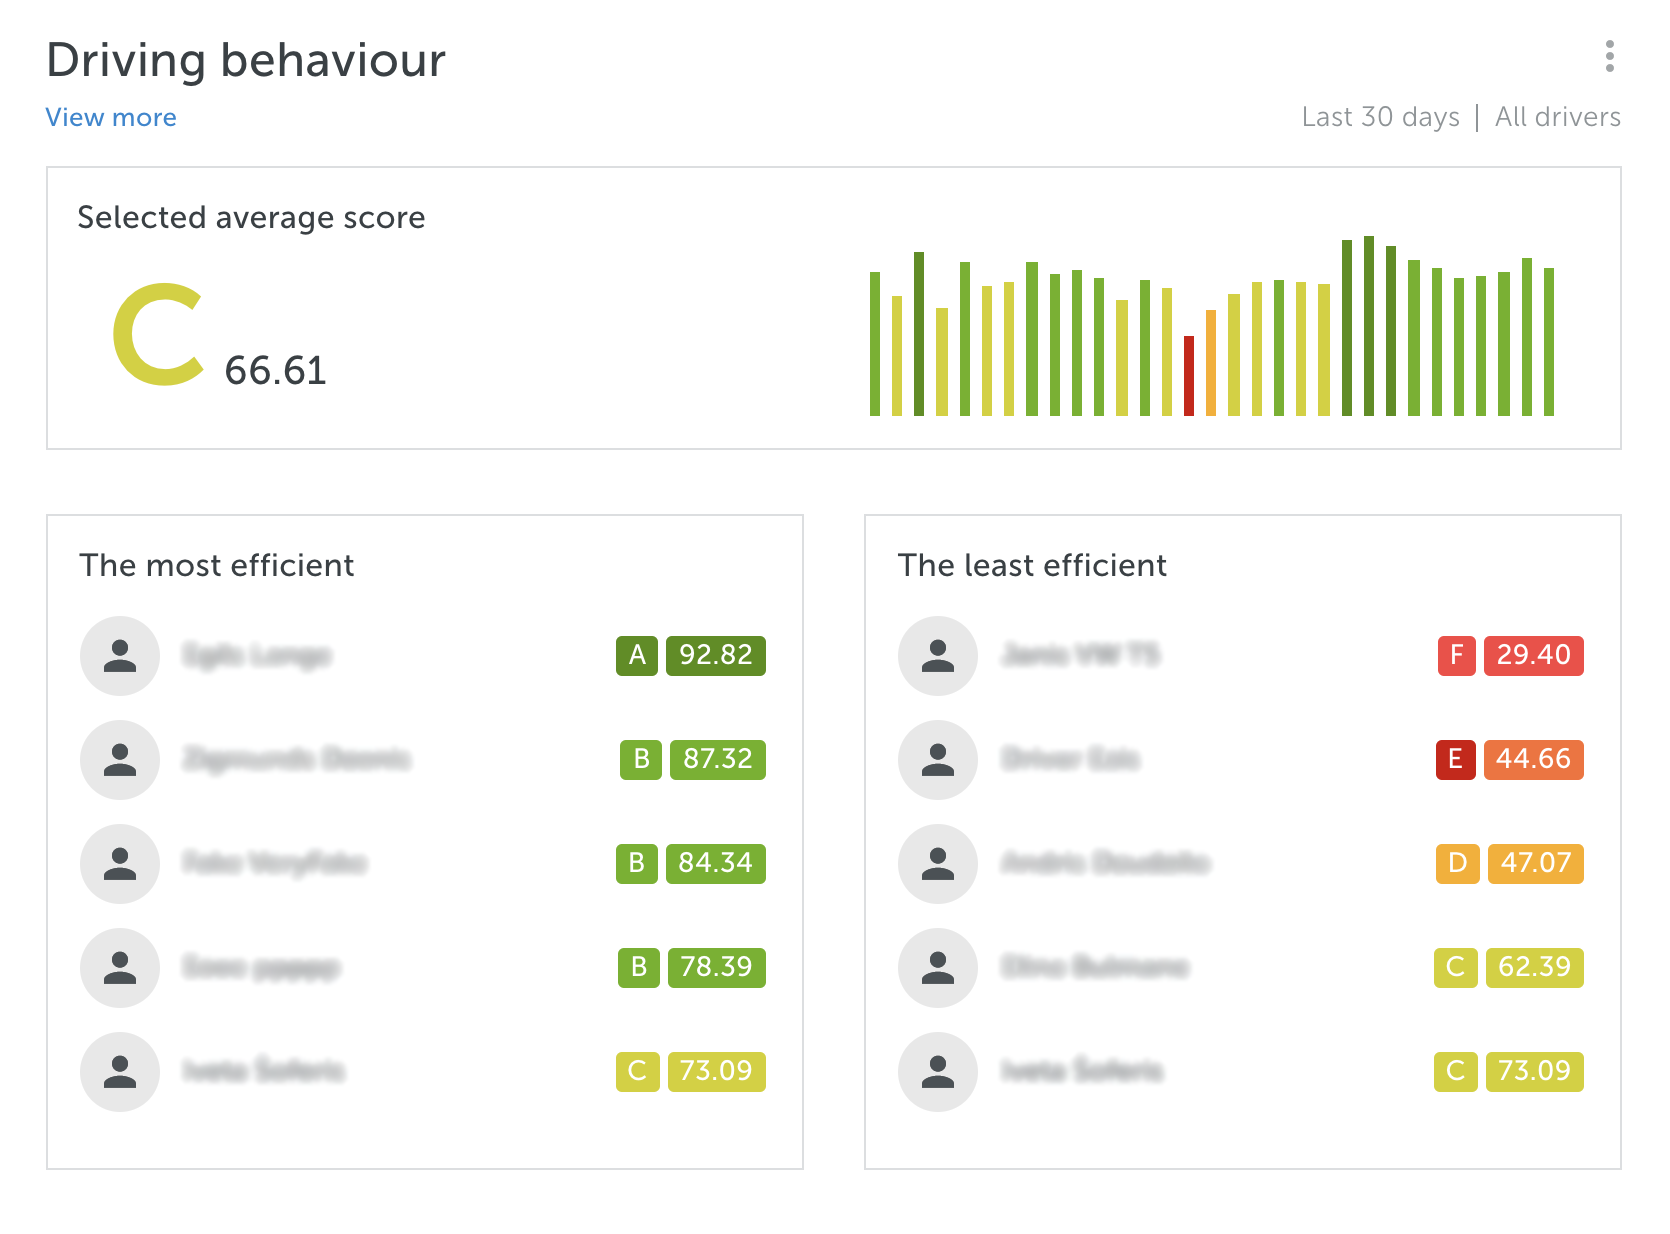
Driver behaviour
This information block consists of three modules, offering an insight into the average day-by-day score for the selected vehicles and drivers, along with the average score for a specific period of time, and the five most and least efficient drivers and vehicles.
Daily mileage
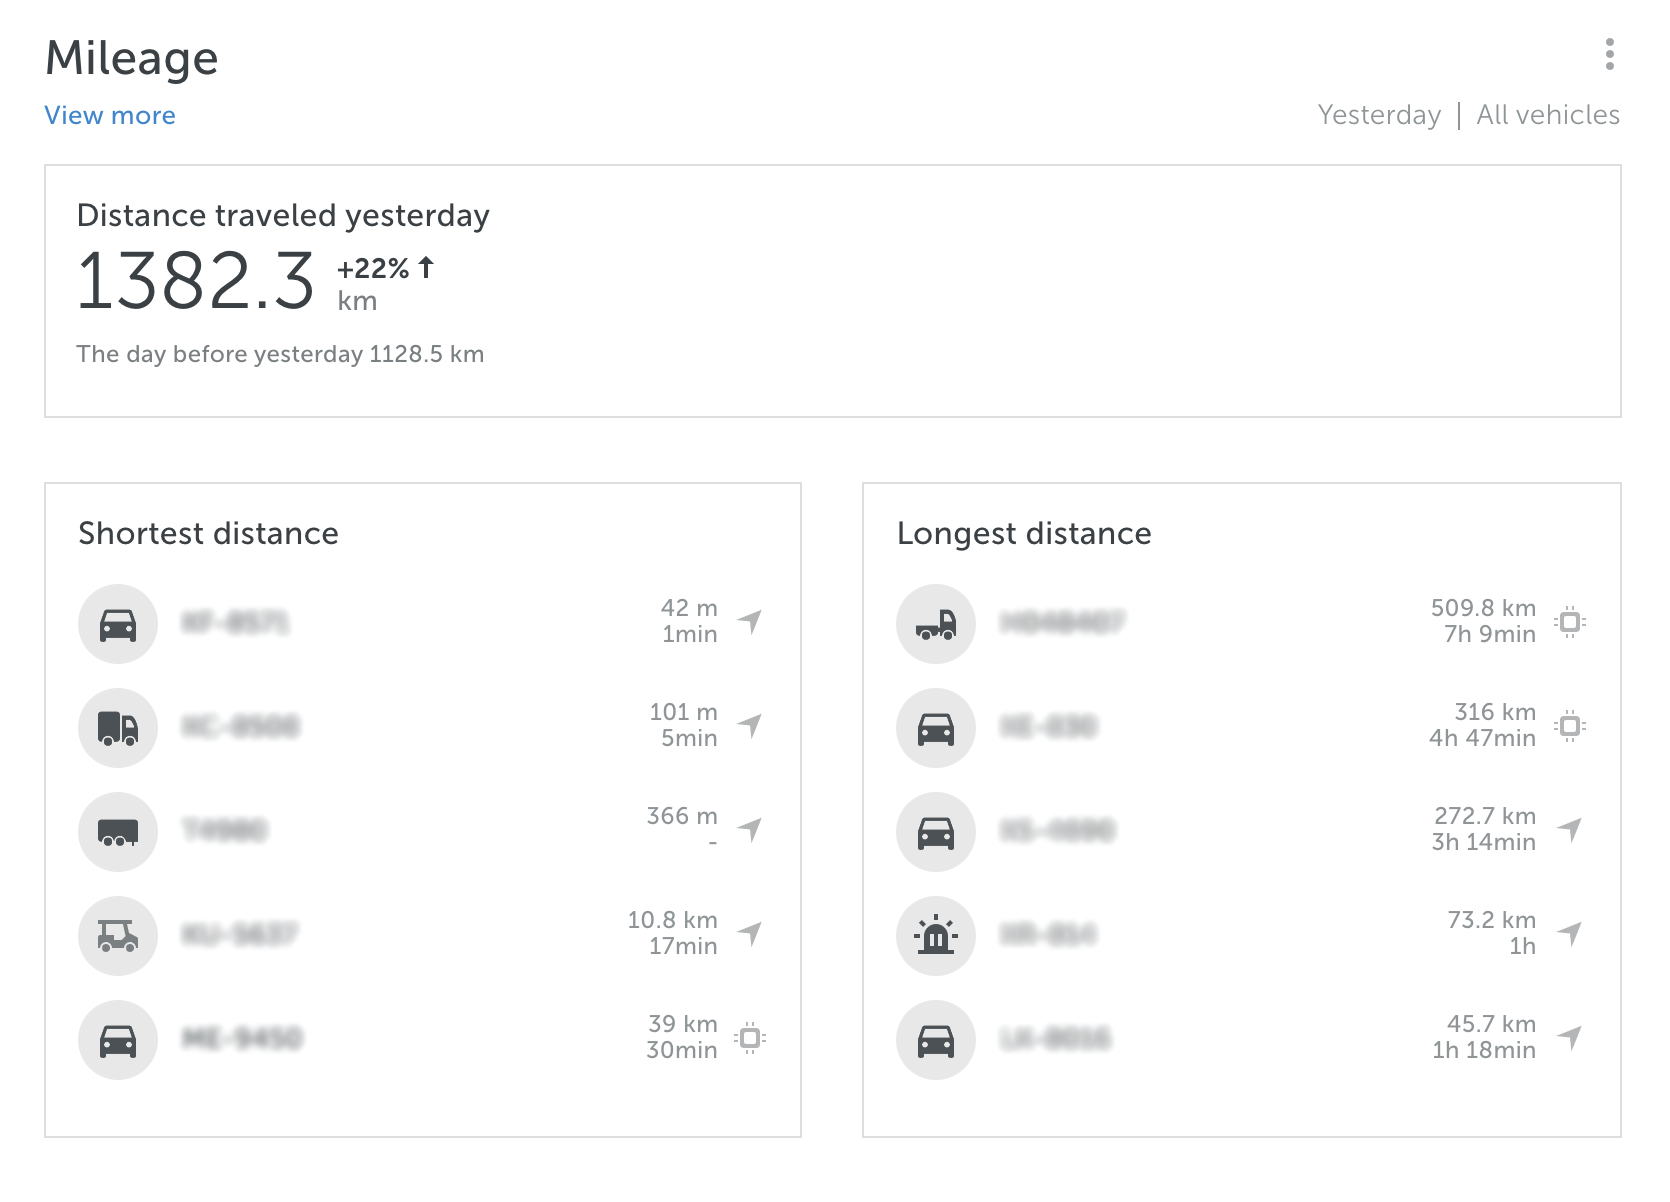
This block, too, has three modules that show data about the total distance travelled on the current day, along with information about the longest and shortest distance your fleet vehicles have driven. To see the distances traveled in a specific time frame, select the View more section and mark the desired period. These could be particular days, weeks, or months.
Fuel
Fuel consumption is a very important metric for any fleet, so we created 10 different data modules for adding to Dashboards:
- Average fuel consumption graph that includes a comparison to the previous time period as well as the average expected consumption;
- Average consumption by distance;
- Average consumption by time;
- Refuelled volume;
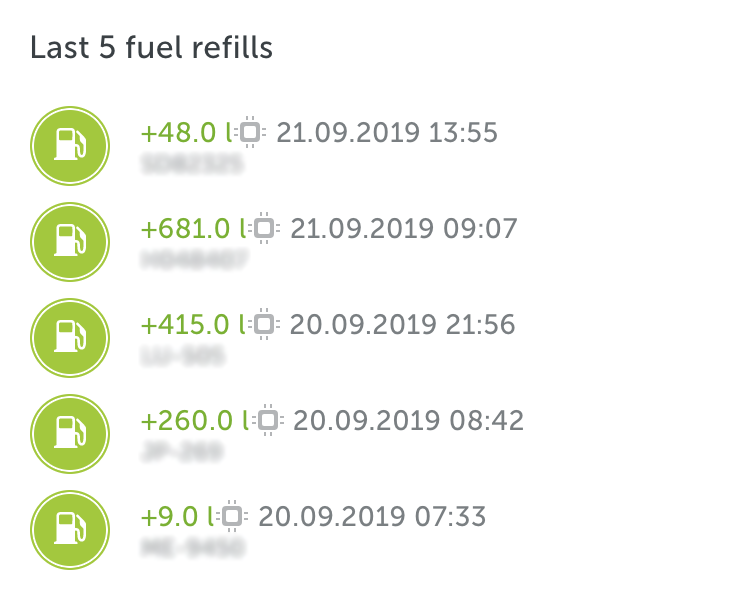
- The last five refills;
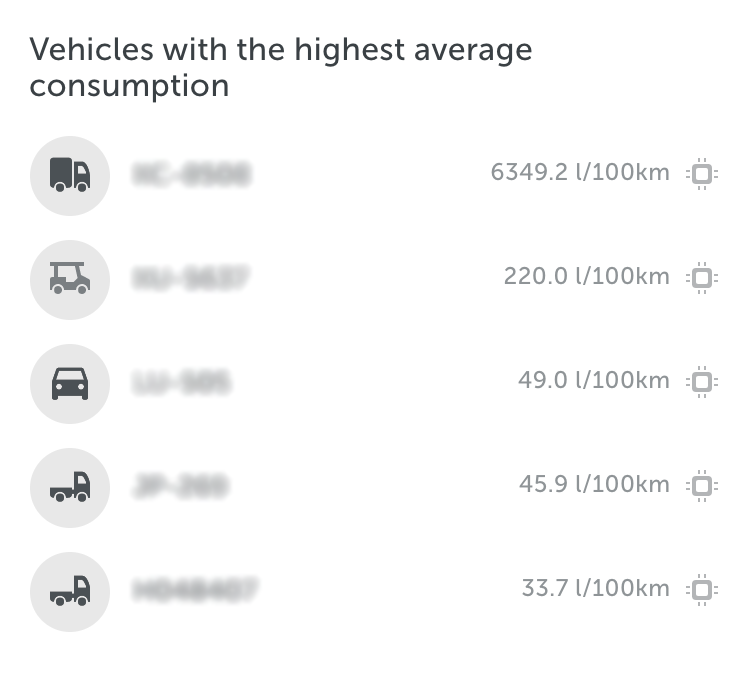
- Vehicles with the highest average fuel consumption;
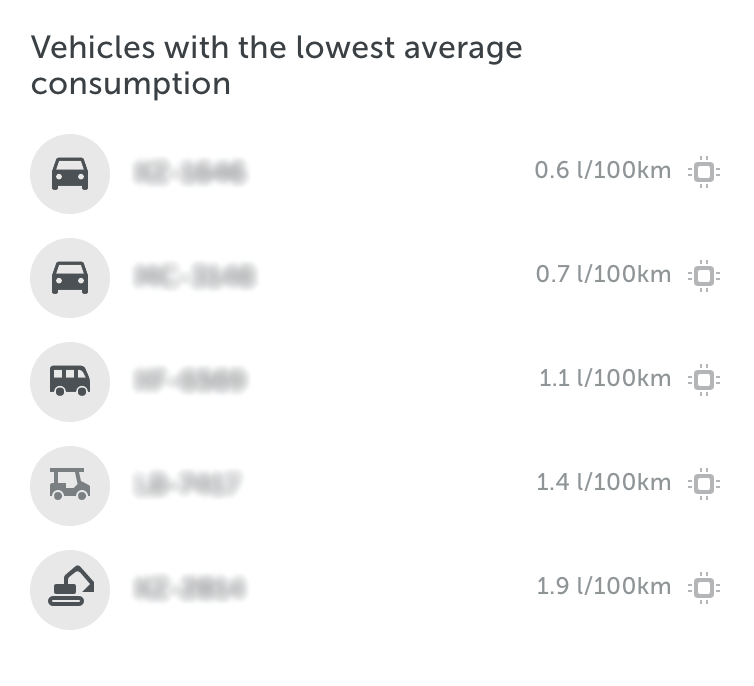
- Vehicles with the lowest average fuel consumption;
- Total fuel consumed;
- Fuel drained;
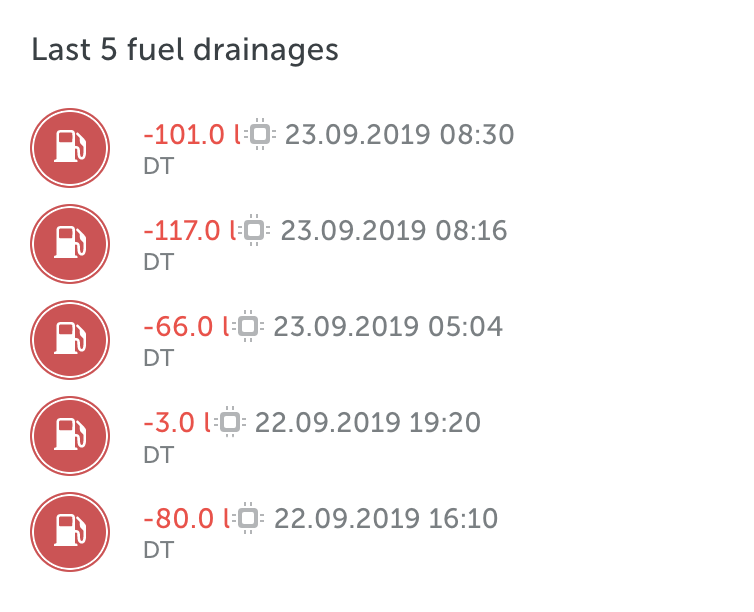
- The last five drainages.
Working hours
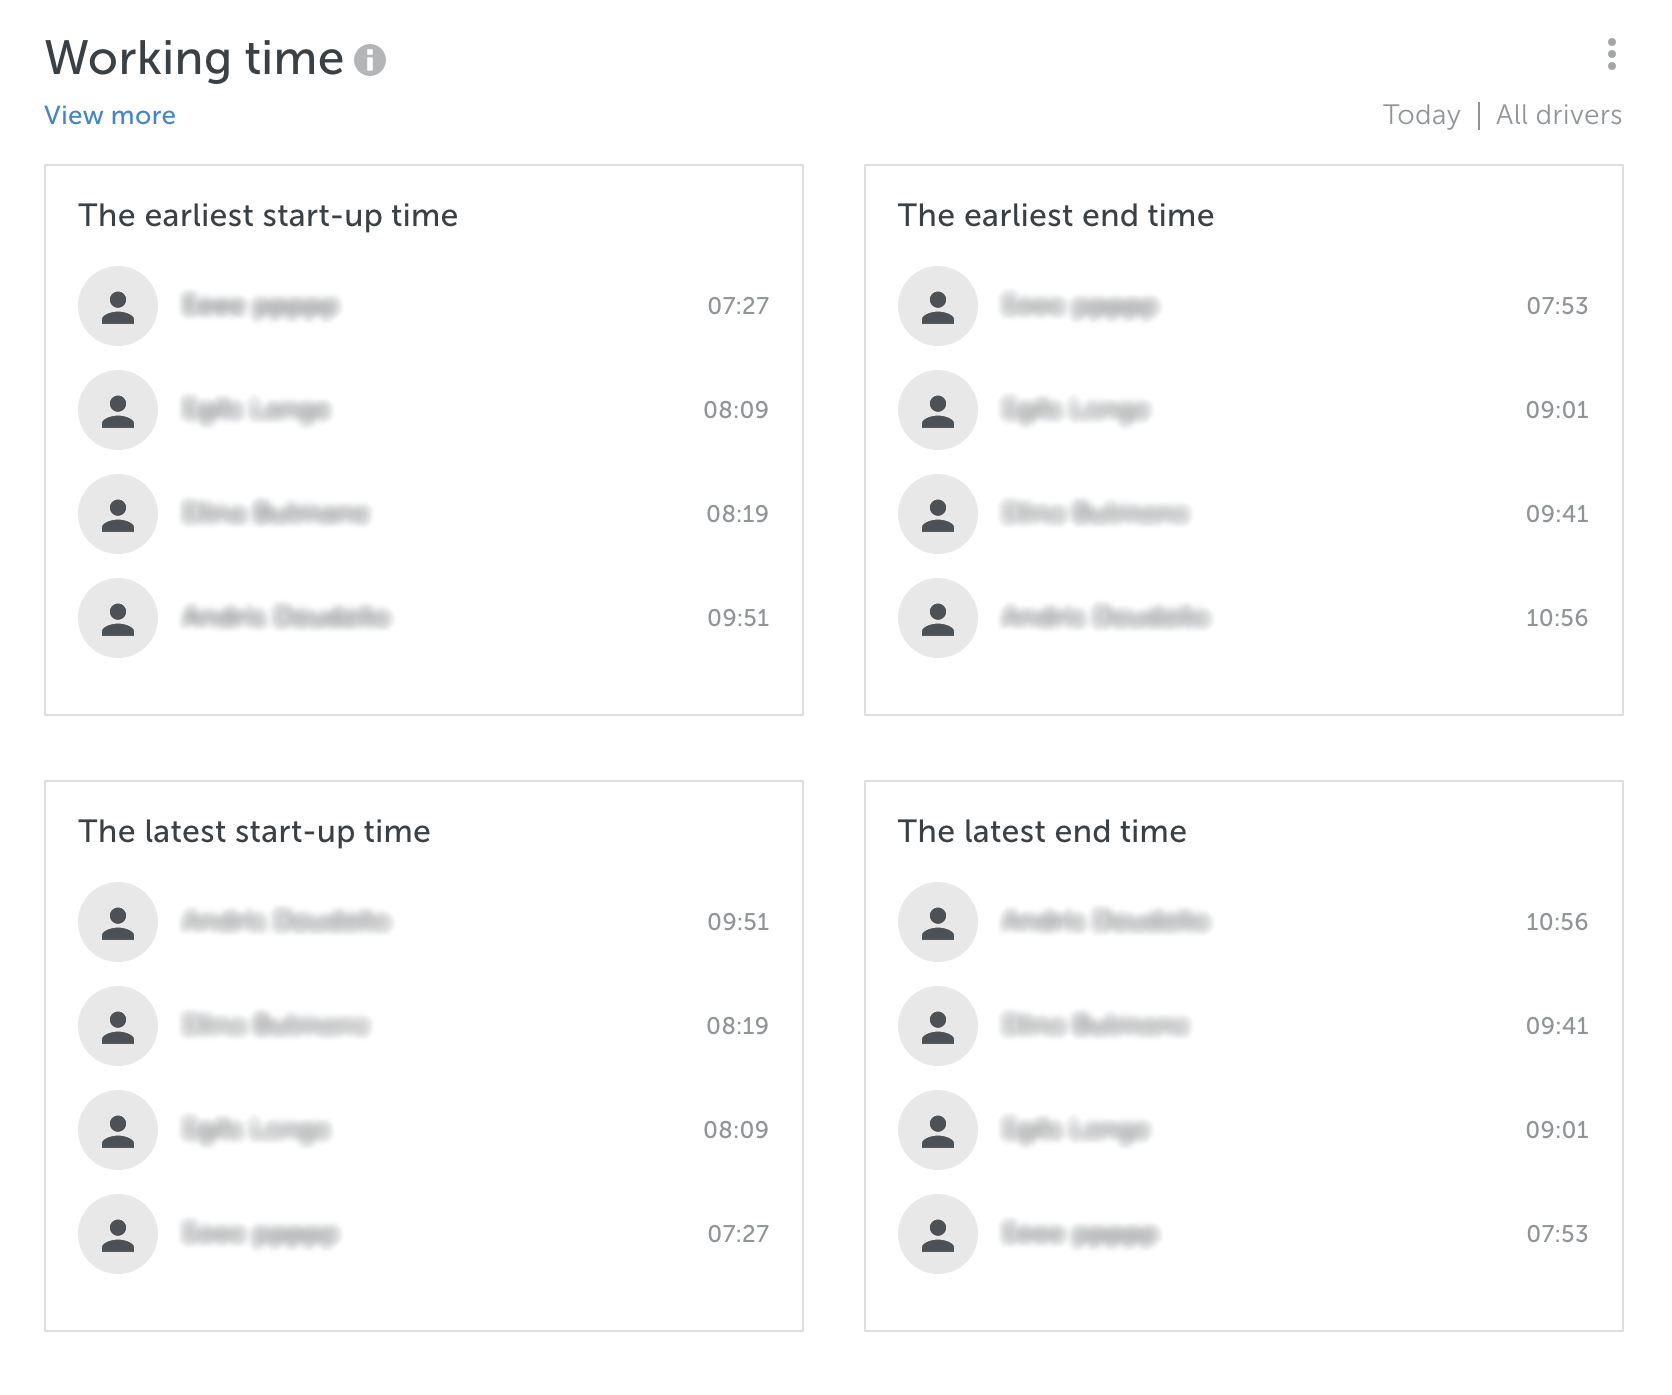
The main idea of this block is to see at what time a driver or vehicle started and ended the work. It consists of three modules that include data about the earliest and latest times when the work started and ended. There’s also data about driving outside of the working hours available if you have our Driving Log solution enabled.
All information blocks are fully customisable – you can change their settings at any time and rearrange the blocks using drag and drop feature.
For any fleet, regardless of its size
Dashboards will help you stay on the top of all the important information about your fleet, no matter how big or small it is. All the graphs are easy-to-understand and visually appealing, so you can quickly understand the current situation in your fleet. Maybe it could even serve as a great solution to put on the screens at the entrance of your head office!
The Dashboards section is available for all Mapon system users along with many other useful features. Want to see how would it work for your business? Sign up to get a free quote or start the 14-day free trial right away!


