How to measure and improve fleet efficiency in your company?
When your business grows, your fleet grows along with it. Eventually, it becomes quite a challenge to manage it and ensure high fleet efficiency levels. The more vehicles you have, the harder it is to understand whether it’s enough, too much or too little. This is an issue many private companies and state organisations face today, so we, at Mapon, created a brand new fleet efficiency solution that will help you decide what changes your fleet needs to improve its overall performance. After all, would you want to analyse it all by yourself or rather trust a convenient system?
How does it work?
Each fleet is very different from the other, and so are the fleet usage patterns. There are vehicles that are used only on specific hours of the day, the ones that are driving when being operated and those used in a stationary state. To illustrate this, imagine a regular light vehicle used to get to and from work, a truck being operated on long distances or construction vehicles. With Mapon fleet efficiency solution, you’ll have automated transparency of your fleet performance, regardless of the type of vehicles you have.
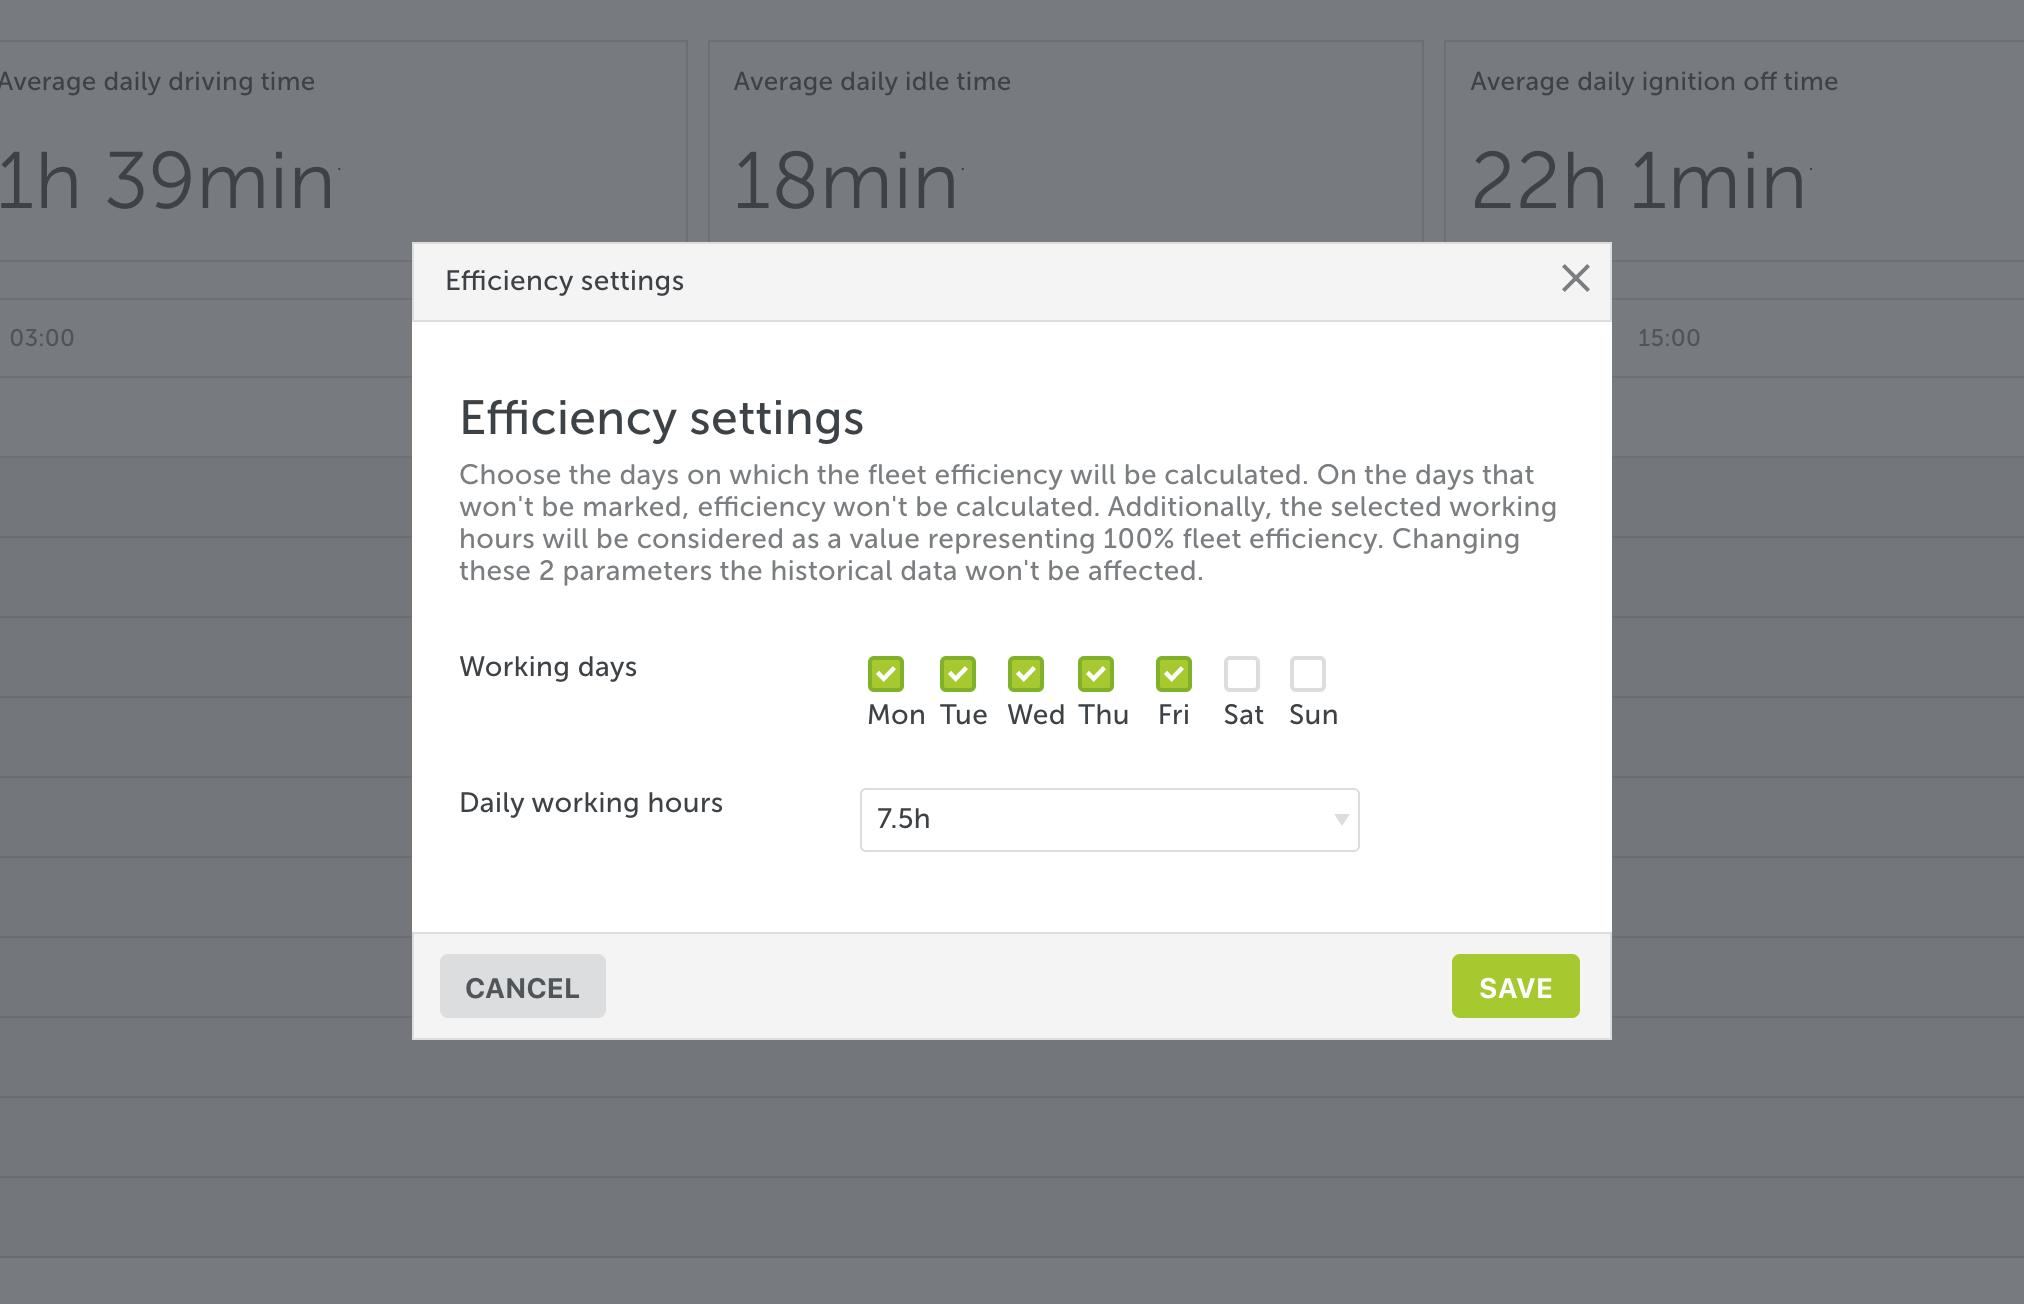
To start using the solution, you should determine the days on which the fleet efficiency will be calculated. Additionally, you can set the daily working hours that will be considered as a value representing a 100% efficiency. For instance, if you only use company vehicles 7,5 hours a day from Monday to Friday, this is how you should configure the settings to get precise efficiency calculations:
Our system gathers data from all vehicles once a day and stores it in the system, therefore changing the working days and/or daily working hours or uninstalling the tracking device from the vehicle won’t affect the historical data. So, in short, the
fleet efficiency is a snapshot of the company fleet state on a specific date.
A detailed efficiency calculation
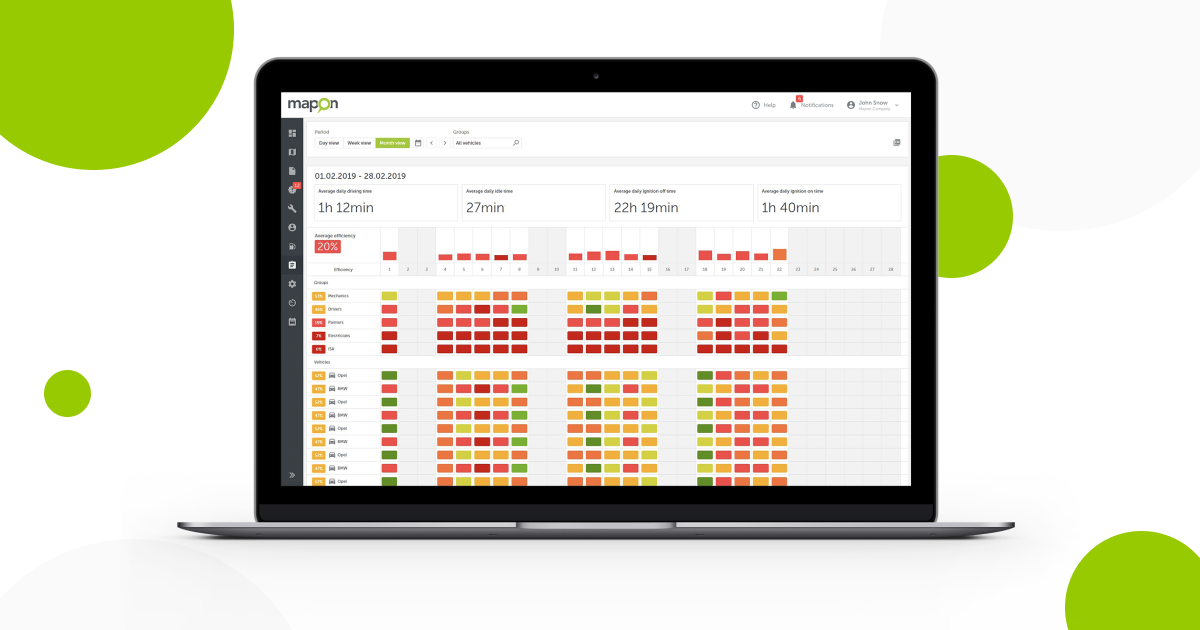
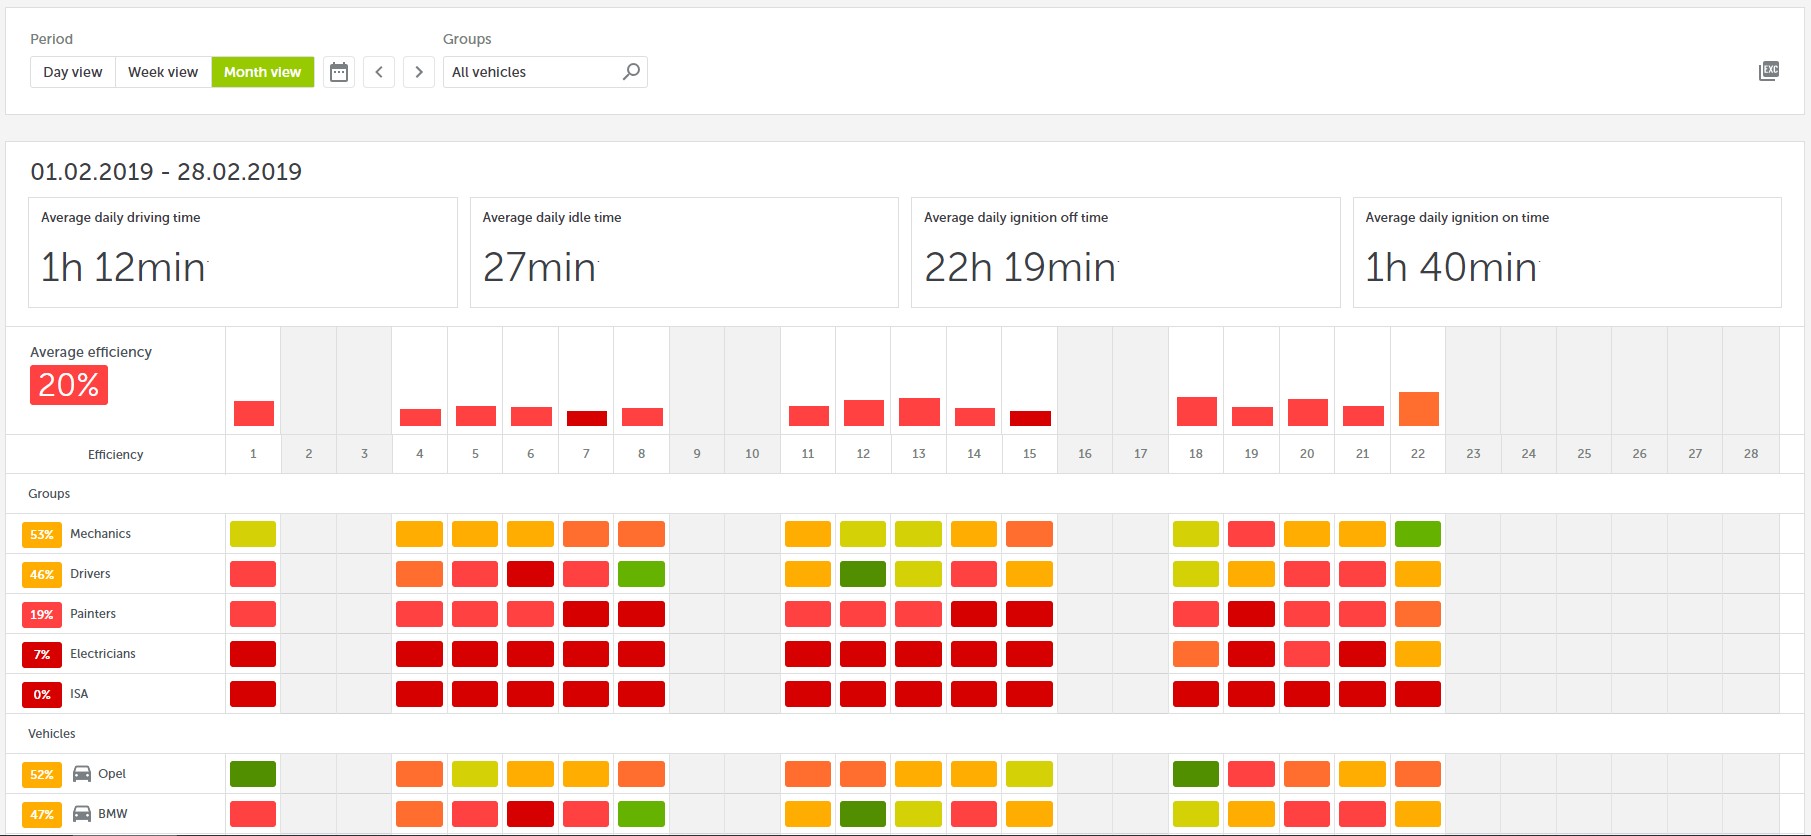
Fleet efficiency is measured from 0 to 100%, and the general score is displayed using a simple colour scheme where:
- The red colour marks the lowest efficiency score;
- The orange and yellow colour shows the average efficiency rates;
- The green colour showcases good and excellent results.
You can analyse the efficiency by vehicle groups, ungrouped vehicles or for the whole fleet. Also, for your convenience, the overview is available in a day, week and month view.
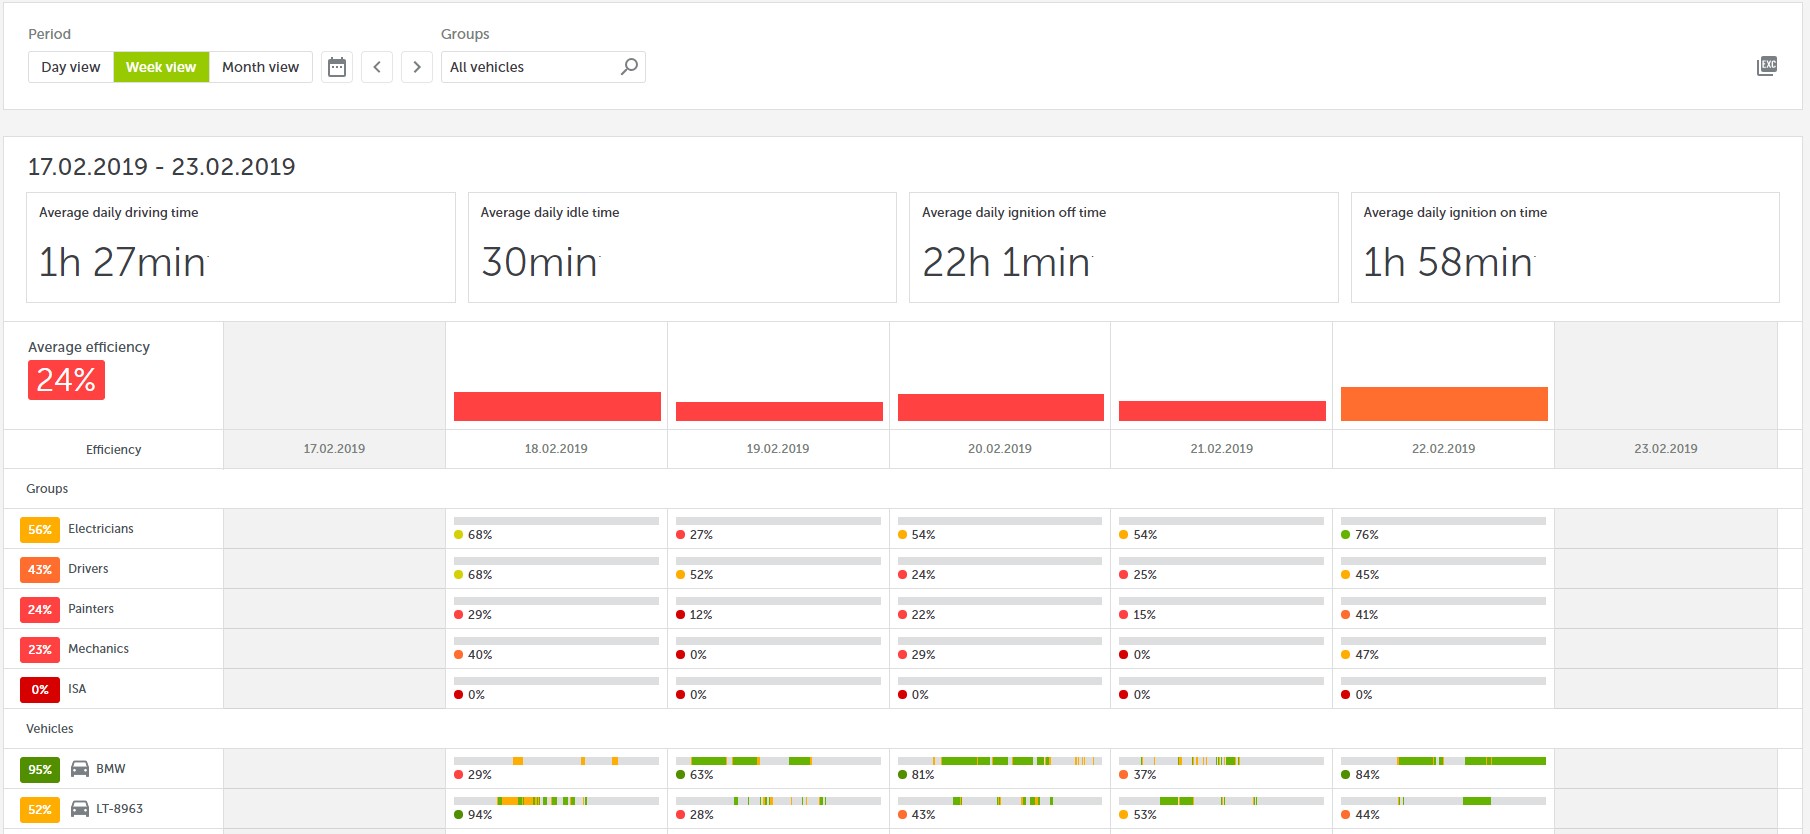
There are five easy-to-understand dashboards on a day, week and month view that show the average daily values for the following parameters:
1. Efficiency;
2. Driving time;
3. Idle time;
4. Ignition off time;
5. Ignition on time.
All values on dashboards will be shown based on your chosen period of time and grouped/ungrouped vehicles. Nevertheless, each user will only be able to see those vehicle groups and ungrouped vehicles that he/she has access to.
The main differences between the day, week and month views are:
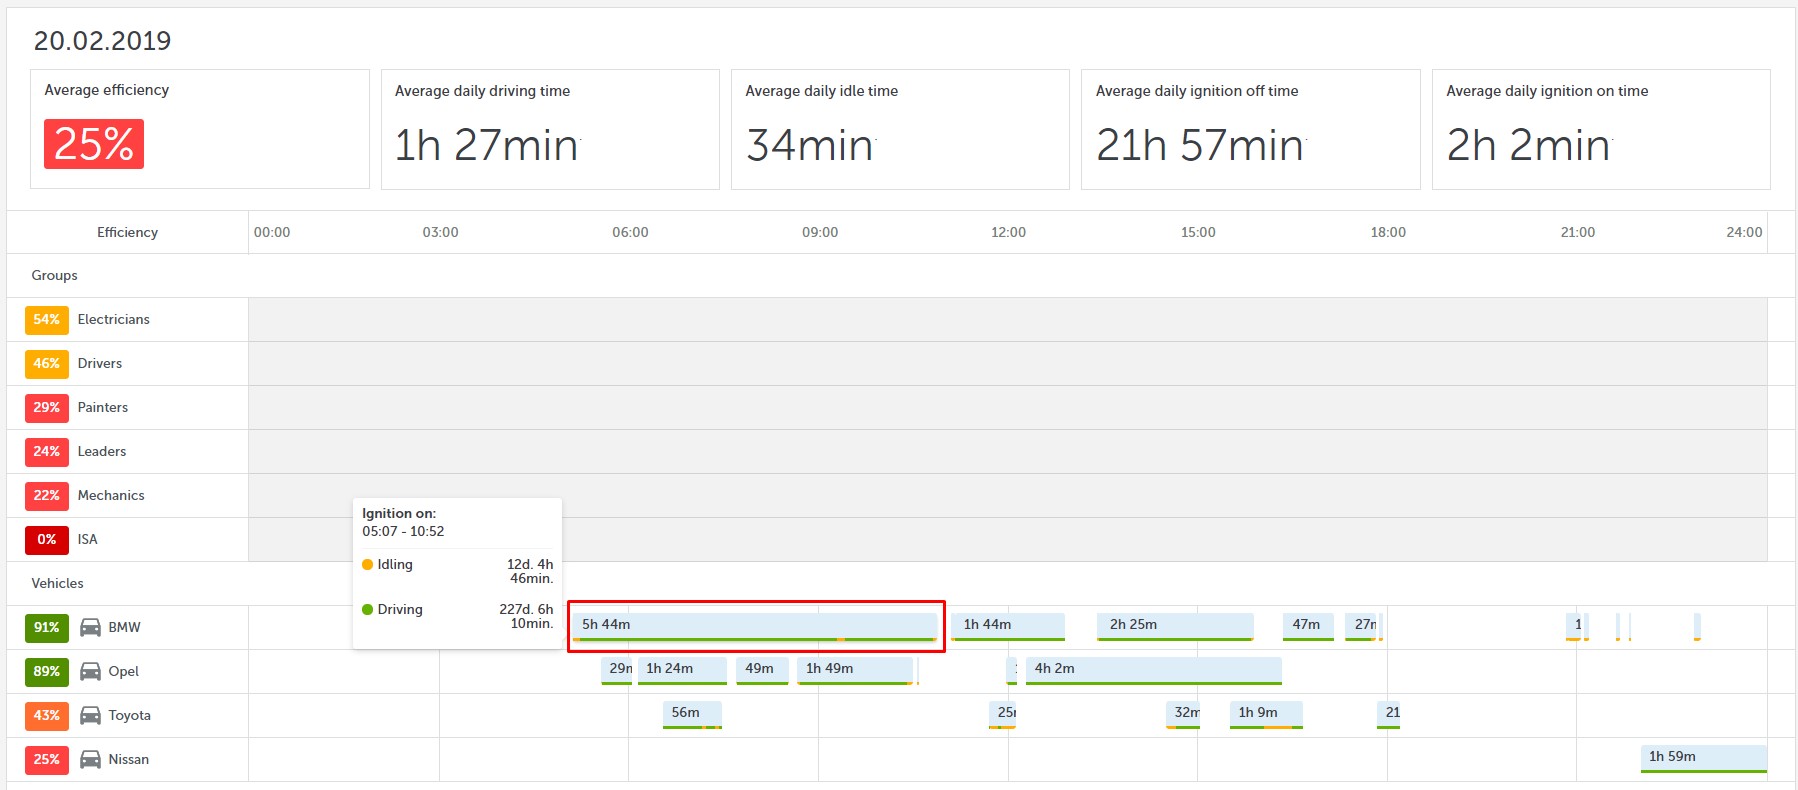
- The day view offers a detailed analysis of each vehicle individually: which hours were spent driving, idling, with ignition on and off. Moreover, when clicking on a specific vehicle timing bar, you’ll be able to see all routes the vehicle took on that day.
- The week view will show you the fleet efficiency for selected vehicles and groups for one week, as well as the average daily efficiency, ignition on and off, idling and driving time values. Additionally, the week view includes the total values per day for each vehicle separately. The month view has the same functionality and shows the efficiency data for one month.
The way to improve efficiency and lower costs
Both private sector and government institutions can benefit from using the fleet efficiency solution. As stated in the recent report by the Latvian State Chancellery,
at the beginning of 2019 government institutions had 301 vehicles with low yearly mileage
(under 8500 km). Although they’ve managed to reduce the number of inefficient vehicles from 450 in August 2018, it has taken a lot of time and manpower to calculate the current fleet efficiency and execute an action plan towards achieving higher efficiency levels. Now, there’s a ready-to-use solution that will gather the data for all fleet in a much faster and convenient manner, allowing organisations to see the big picture and improve how their business operations work.
Being able to track your fleet performance can also help you optimise the size of your fleet and save valuable resources – time and money – in the long run. Nevertheless, the solution can help to determine whether you really need all your company vehicles without the need to prepare huge reports manually – the system will do it all for you.
As you can see, there are many options on how to evaluate your fleet efficiency from various aspects using Mapon fleet efficiency solution. Our team will be happy to explain you more about it, so don’t hesitate to contact us via info@mapon.com or +371 67271803.


